Ottawa vs Immigrants from Bolivia Professional Degree
COMPARE
Ottawa
Immigrants from Bolivia
Professional Degree
Professional Degree Comparison
Ottawa
Immigrants from Bolivia
3.4%
PROFESSIONAL DEGREE
0.2/ 100
METRIC RATING
298th/ 347
METRIC RANK
5.5%
PROFESSIONAL DEGREE
99.9/ 100
METRIC RATING
65th/ 347
METRIC RANK
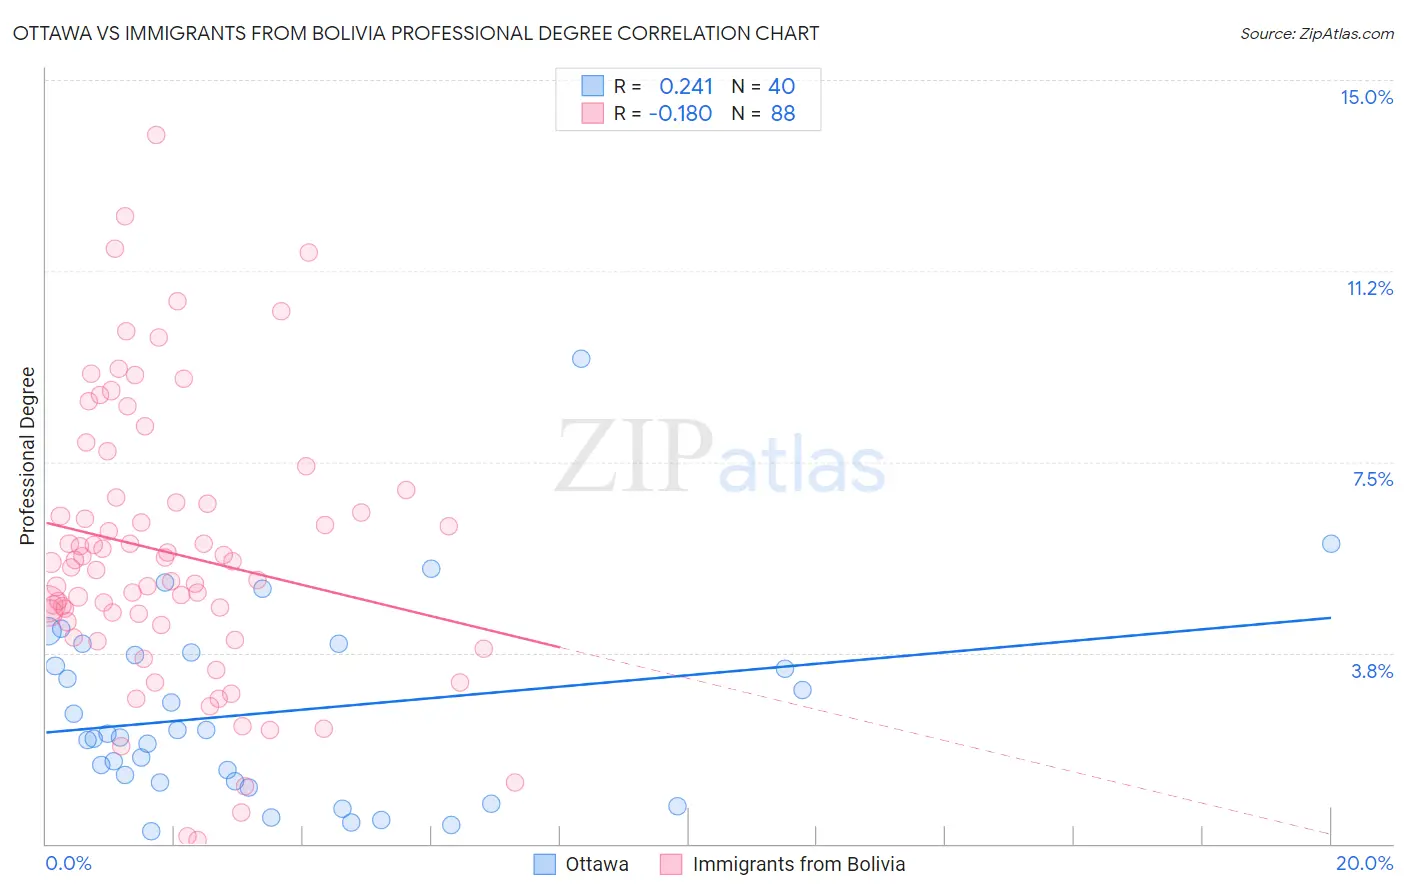
Ottawa vs Immigrants from Bolivia Professional Degree Correlation Chart
The statistical analysis conducted on geographies consisting of 49,856,239 people shows a weak positive correlation between the proportion of Ottawa and percentage of population with at least professional degree education in the United States with a correlation coefficient (R) of 0.241 and weighted average of 3.4%. Similarly, the statistical analysis conducted on geographies consisting of 158,681,411 people shows a poor negative correlation between the proportion of Immigrants from Bolivia and percentage of population with at least professional degree education in the United States with a correlation coefficient (R) of -0.180 and weighted average of 5.5%, a difference of 60.4%.
Professional Degree Correlation Summary
| Measurement | Ottawa | Immigrants from Bolivia |
| Minimum | 0.25% | 0.081% |
| Maximum | 9.5% | 13.9% |
| Range | 9.3% | 13.8% |
| Mean | 2.6% | 5.7% |
| Median | 2.1% | 5.5% |
| Interquartile 25% (IQ1) | 1.2% | 4.3% |
| Interquartile 75% (IQ3) | 3.7% | 6.7% |
| Interquartile Range (IQR) | 2.5% | 2.4% |
| Standard Deviation (Sample) | 1.9% | 2.7% |
| Standard Deviation (Population) | 1.9% | 2.7% |
Similar Demographics by Professional Degree
Demographics Similar to Ottawa by Professional Degree
In terms of professional degree, the demographic groups most similar to Ottawa are Immigrants from Liberia (3.4%, a difference of 0.050%), Hawaiian (3.4%, a difference of 0.39%), Immigrants from Guatemala (3.4%, a difference of 0.40%), Paiute (3.4%, a difference of 0.56%), and Immigrants from Honduras (3.5%, a difference of 0.64%).
| Demographics | Rating | Rank | Professional Degree |
| Alaska Natives | 0.3 /100 | #291 | Tragic 3.5% |
| Immigrants | Belize | 0.3 /100 | #292 | Tragic 3.5% |
| Immigrants | Honduras | 0.3 /100 | #293 | Tragic 3.5% |
| Paiute | 0.3 /100 | #294 | Tragic 3.4% |
| Immigrants | Guatemala | 0.2 /100 | #295 | Tragic 3.4% |
| Hawaiians | 0.2 /100 | #296 | Tragic 3.4% |
| Immigrants | Liberia | 0.2 /100 | #297 | Tragic 3.4% |
| Ottawa | 0.2 /100 | #298 | Tragic 3.4% |
| Immigrants | Yemen | 0.2 /100 | #299 | Tragic 3.4% |
| Blacks/African Americans | 0.2 /100 | #300 | Tragic 3.4% |
| Immigrants | Dominican Republic | 0.2 /100 | #301 | Tragic 3.4% |
| Malaysians | 0.2 /100 | #302 | Tragic 3.4% |
| Immigrants | Haiti | 0.2 /100 | #303 | Tragic 3.4% |
| Cajuns | 0.2 /100 | #304 | Tragic 3.4% |
| Chickasaw | 0.1 /100 | #305 | Tragic 3.4% |
Demographics Similar to Immigrants from Bolivia by Professional Degree
In terms of professional degree, the demographic groups most similar to Immigrants from Bolivia are Immigrants from Asia (5.5%, a difference of 0.060%), Asian (5.5%, a difference of 0.13%), Immigrants from Kazakhstan (5.5%, a difference of 0.24%), Immigrants from Belarus (5.5%, a difference of 0.56%), and Immigrants from Bulgaria (5.5%, a difference of 0.56%).
| Demographics | Rating | Rank | Professional Degree |
| Bulgarians | 100.0 /100 | #58 | Exceptional 5.7% |
| Immigrants | Europe | 100.0 /100 | #59 | Exceptional 5.6% |
| Bolivians | 99.9 /100 | #60 | Exceptional 5.6% |
| Immigrants | Lithuania | 99.9 /100 | #61 | Exceptional 5.6% |
| Immigrants | Belarus | 99.9 /100 | #62 | Exceptional 5.5% |
| Asians | 99.9 /100 | #63 | Exceptional 5.5% |
| Immigrants | Asia | 99.9 /100 | #64 | Exceptional 5.5% |
| Immigrants | Bolivia | 99.9 /100 | #65 | Exceptional 5.5% |
| Immigrants | Kazakhstan | 99.9 /100 | #66 | Exceptional 5.5% |
| Immigrants | Bulgaria | 99.9 /100 | #67 | Exceptional 5.5% |
| Immigrants | Lebanon | 99.9 /100 | #68 | Exceptional 5.5% |
| Immigrants | Hungary | 99.9 /100 | #69 | Exceptional 5.5% |
| Bhutanese | 99.8 /100 | #70 | Exceptional 5.4% |
| Immigrants | Western Asia | 99.8 /100 | #71 | Exceptional 5.4% |
| Lithuanians | 99.8 /100 | #72 | Exceptional 5.4% |