Ottawa vs Cambodian Professional Degree
COMPARE
Ottawa
Cambodian
Professional Degree
Professional Degree Comparison
Ottawa
Cambodians
3.4%
PROFESSIONAL DEGREE
0.2/ 100
METRIC RATING
298th/ 347
METRIC RANK
6.0%
PROFESSIONAL DEGREE
100.0/ 100
METRIC RATING
40th/ 347
METRIC RANK
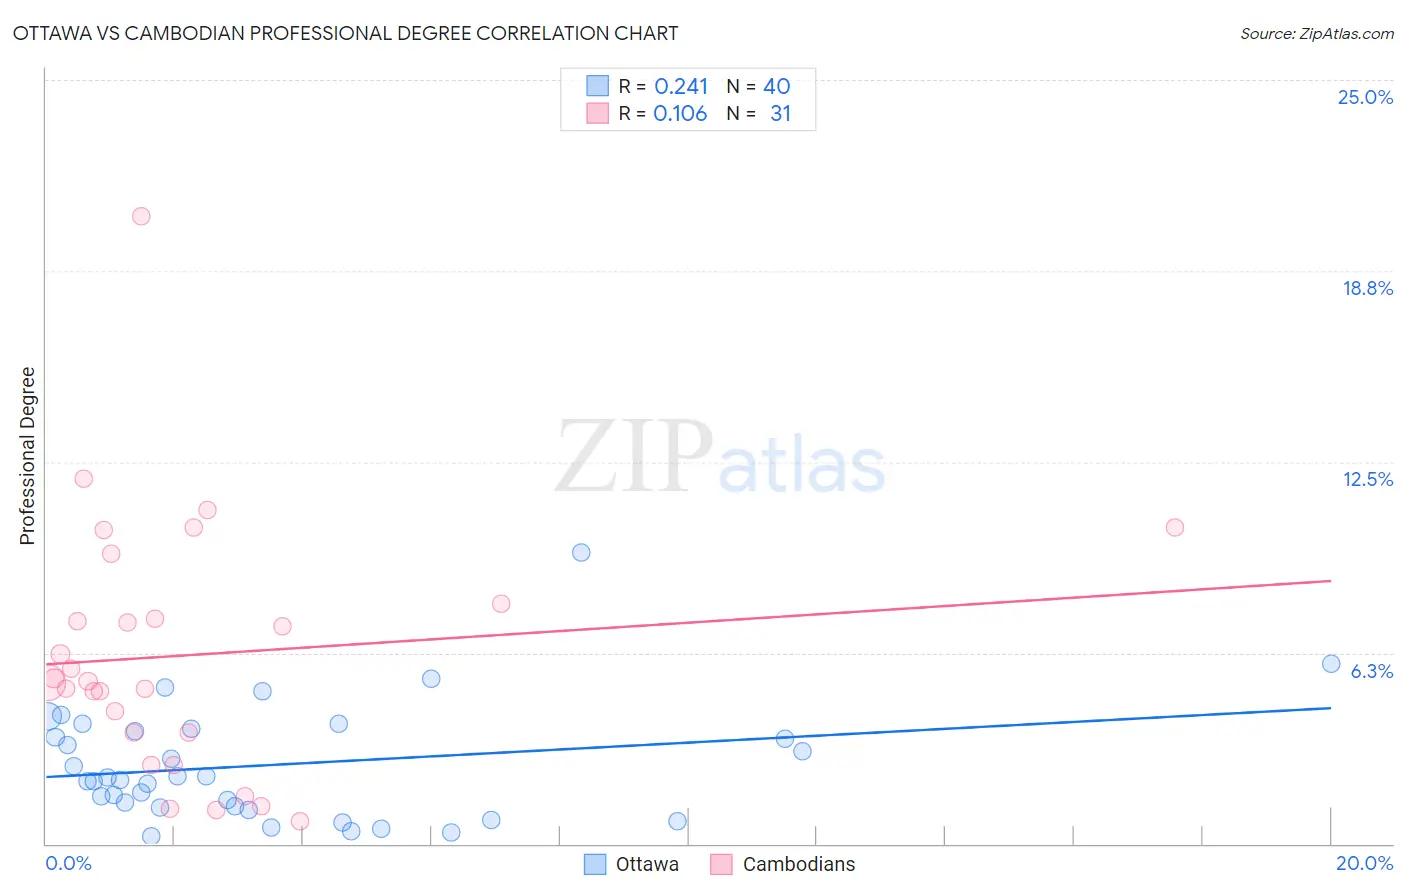
Ottawa vs Cambodian Professional Degree Correlation Chart
The statistical analysis conducted on geographies consisting of 49,856,239 people shows a weak positive correlation between the proportion of Ottawa and percentage of population with at least professional degree education in the United States with a correlation coefficient (R) of 0.241 and weighted average of 3.4%. Similarly, the statistical analysis conducted on geographies consisting of 102,442,026 people shows a poor positive correlation between the proportion of Cambodians and percentage of population with at least professional degree education in the United States with a correlation coefficient (R) of 0.106 and weighted average of 6.0%, a difference of 74.0%.
Professional Degree Correlation Summary
| Measurement | Ottawa | Cambodian |
| Minimum | 0.25% | 0.74% |
| Maximum | 9.5% | 20.5% |
| Range | 9.3% | 19.8% |
| Mean | 2.6% | 6.2% |
| Median | 2.1% | 5.3% |
| Interquartile 25% (IQ1) | 1.2% | 3.6% |
| Interquartile 75% (IQ3) | 3.7% | 7.9% |
| Interquartile Range (IQR) | 2.5% | 4.2% |
| Standard Deviation (Sample) | 1.9% | 4.1% |
| Standard Deviation (Population) | 1.9% | 4.0% |
Similar Demographics by Professional Degree
Demographics Similar to Ottawa by Professional Degree
In terms of professional degree, the demographic groups most similar to Ottawa are Immigrants from Liberia (3.4%, a difference of 0.050%), Hawaiian (3.4%, a difference of 0.39%), Immigrants from Guatemala (3.4%, a difference of 0.40%), Paiute (3.4%, a difference of 0.56%), and Immigrants from Honduras (3.5%, a difference of 0.64%).
| Demographics | Rating | Rank | Professional Degree |
| Alaska Natives | 0.3 /100 | #291 | Tragic 3.5% |
| Immigrants | Belize | 0.3 /100 | #292 | Tragic 3.5% |
| Immigrants | Honduras | 0.3 /100 | #293 | Tragic 3.5% |
| Paiute | 0.3 /100 | #294 | Tragic 3.4% |
| Immigrants | Guatemala | 0.2 /100 | #295 | Tragic 3.4% |
| Hawaiians | 0.2 /100 | #296 | Tragic 3.4% |
| Immigrants | Liberia | 0.2 /100 | #297 | Tragic 3.4% |
| Ottawa | 0.2 /100 | #298 | Tragic 3.4% |
| Immigrants | Yemen | 0.2 /100 | #299 | Tragic 3.4% |
| Blacks/African Americans | 0.2 /100 | #300 | Tragic 3.4% |
| Immigrants | Dominican Republic | 0.2 /100 | #301 | Tragic 3.4% |
| Malaysians | 0.2 /100 | #302 | Tragic 3.4% |
| Immigrants | Haiti | 0.2 /100 | #303 | Tragic 3.4% |
| Cajuns | 0.2 /100 | #304 | Tragic 3.4% |
| Chickasaw | 0.1 /100 | #305 | Tragic 3.4% |
Demographics Similar to Cambodians by Professional Degree
In terms of professional degree, the demographic groups most similar to Cambodians are New Zealander (6.0%, a difference of 0.18%), Estonian (6.0%, a difference of 0.19%), Immigrants from South Africa (6.0%, a difference of 0.47%), Immigrants from Saudi Arabia (5.9%, a difference of 0.52%), and Argentinean (5.9%, a difference of 0.68%).
| Demographics | Rating | Rank | Professional Degree |
| Burmese | 100.0 /100 | #33 | Exceptional 6.1% |
| Mongolians | 100.0 /100 | #34 | Exceptional 6.1% |
| Immigrants | Korea | 100.0 /100 | #35 | Exceptional 6.1% |
| Immigrants | Russia | 100.0 /100 | #36 | Exceptional 6.0% |
| Immigrants | Austria | 100.0 /100 | #37 | Exceptional 6.0% |
| Immigrants | Norway | 100.0 /100 | #38 | Exceptional 6.0% |
| Immigrants | South Africa | 100.0 /100 | #39 | Exceptional 6.0% |
| Cambodians | 100.0 /100 | #40 | Exceptional 6.0% |
| New Zealanders | 100.0 /100 | #41 | Exceptional 6.0% |
| Estonians | 100.0 /100 | #42 | Exceptional 6.0% |
| Immigrants | Saudi Arabia | 100.0 /100 | #43 | Exceptional 5.9% |
| Argentineans | 100.0 /100 | #44 | Exceptional 5.9% |
| Immigrants | South Central Asia | 100.0 /100 | #45 | Exceptional 5.9% |
| Immigrants | Argentina | 100.0 /100 | #46 | Exceptional 5.9% |
| Australians | 100.0 /100 | #47 | Exceptional 5.9% |