Ottawa vs Immigrants from Northern Europe Professional Degree
COMPARE
Ottawa
Immigrants from Northern Europe
Professional Degree
Professional Degree Comparison
Ottawa
Immigrants from Northern Europe
3.4%
PROFESSIONAL DEGREE
0.2/ 100
METRIC RATING
298th/ 347
METRIC RANK
6.2%
PROFESSIONAL DEGREE
100.0/ 100
METRIC RATING
27th/ 347
METRIC RANK
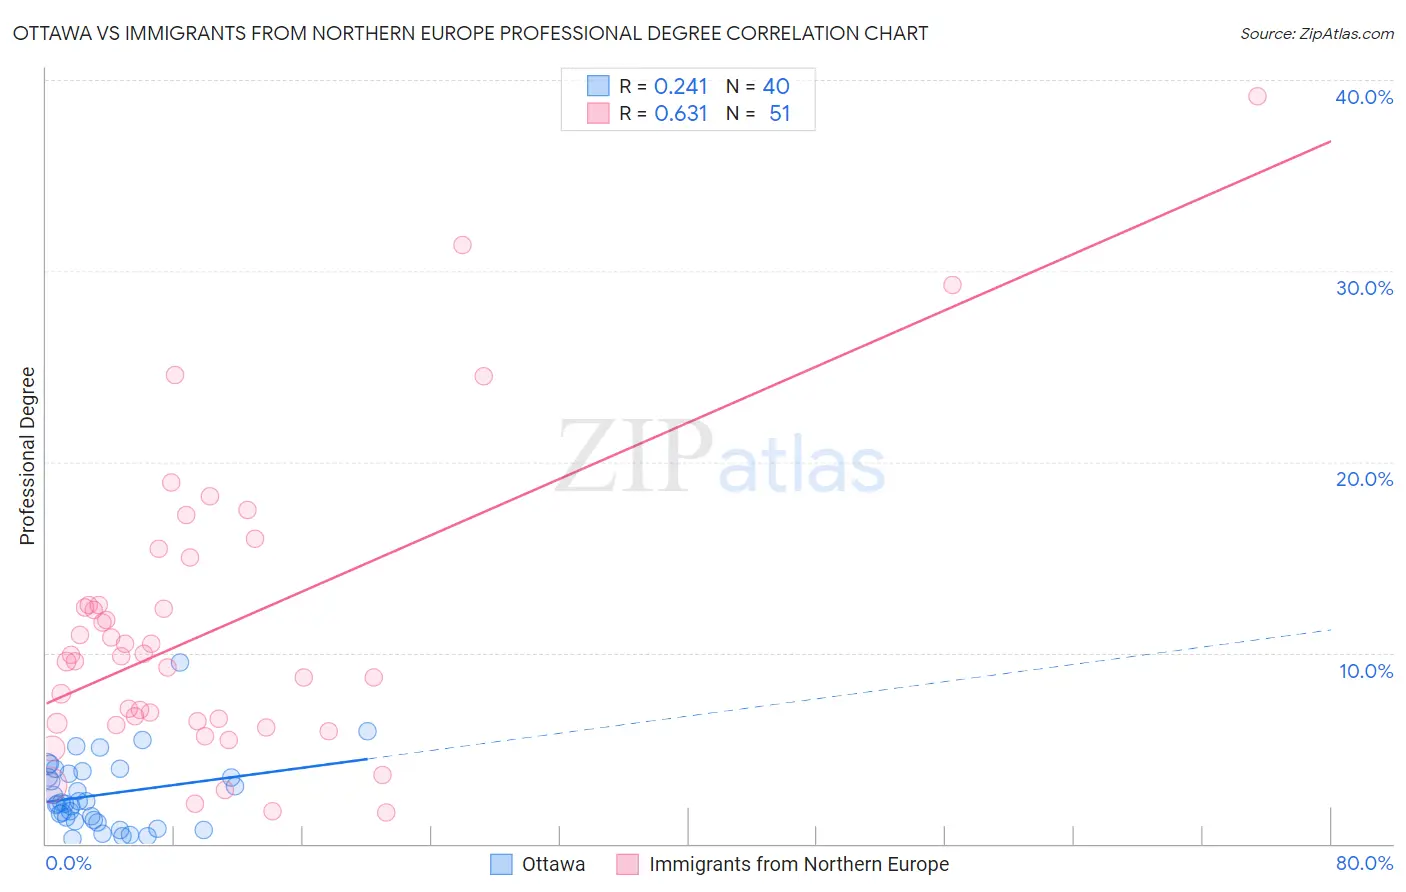
Ottawa vs Immigrants from Northern Europe Professional Degree Correlation Chart
The statistical analysis conducted on geographies consisting of 49,856,239 people shows a weak positive correlation between the proportion of Ottawa and percentage of population with at least professional degree education in the United States with a correlation coefficient (R) of 0.241 and weighted average of 3.4%. Similarly, the statistical analysis conducted on geographies consisting of 475,703,825 people shows a significant positive correlation between the proportion of Immigrants from Northern Europe and percentage of population with at least professional degree education in the United States with a correlation coefficient (R) of 0.631 and weighted average of 6.2%, a difference of 81.1%.
Professional Degree Correlation Summary
| Measurement | Ottawa | Immigrants from Northern Europe |
| Minimum | 0.25% | 1.7% |
| Maximum | 9.5% | 39.2% |
| Range | 9.3% | 37.5% |
| Mean | 2.6% | 11.3% |
| Median | 2.1% | 9.8% |
| Interquartile 25% (IQ1) | 1.2% | 6.3% |
| Interquartile 75% (IQ3) | 3.7% | 12.5% |
| Interquartile Range (IQR) | 2.5% | 6.2% |
| Standard Deviation (Sample) | 1.9% | 7.7% |
| Standard Deviation (Population) | 1.9% | 7.6% |
Similar Demographics by Professional Degree
Demographics Similar to Ottawa by Professional Degree
In terms of professional degree, the demographic groups most similar to Ottawa are Immigrants from Liberia (3.4%, a difference of 0.050%), Hawaiian (3.4%, a difference of 0.39%), Immigrants from Guatemala (3.4%, a difference of 0.40%), Paiute (3.4%, a difference of 0.56%), and Immigrants from Honduras (3.5%, a difference of 0.64%).
| Demographics | Rating | Rank | Professional Degree |
| Alaska Natives | 0.3 /100 | #291 | Tragic 3.5% |
| Immigrants | Belize | 0.3 /100 | #292 | Tragic 3.5% |
| Immigrants | Honduras | 0.3 /100 | #293 | Tragic 3.5% |
| Paiute | 0.3 /100 | #294 | Tragic 3.4% |
| Immigrants | Guatemala | 0.2 /100 | #295 | Tragic 3.4% |
| Hawaiians | 0.2 /100 | #296 | Tragic 3.4% |
| Immigrants | Liberia | 0.2 /100 | #297 | Tragic 3.4% |
| Ottawa | 0.2 /100 | #298 | Tragic 3.4% |
| Immigrants | Yemen | 0.2 /100 | #299 | Tragic 3.4% |
| Blacks/African Americans | 0.2 /100 | #300 | Tragic 3.4% |
| Immigrants | Dominican Republic | 0.2 /100 | #301 | Tragic 3.4% |
| Malaysians | 0.2 /100 | #302 | Tragic 3.4% |
| Immigrants | Haiti | 0.2 /100 | #303 | Tragic 3.4% |
| Cajuns | 0.2 /100 | #304 | Tragic 3.4% |
| Chickasaw | 0.1 /100 | #305 | Tragic 3.4% |
Demographics Similar to Immigrants from Northern Europe by Professional Degree
In terms of professional degree, the demographic groups most similar to Immigrants from Northern Europe are Turkish (6.2%, a difference of 0.11%), Latvian (6.2%, a difference of 0.50%), Immigrants from Sri Lanka (6.2%, a difference of 0.75%), Immigrants from Turkey (6.2%, a difference of 0.75%), and Immigrants from India (6.2%, a difference of 0.87%).
| Demographics | Rating | Rank | Professional Degree |
| Immigrants | Denmark | 100.0 /100 | #20 | Exceptional 6.4% |
| Immigrants | Hong Kong | 100.0 /100 | #21 | Exceptional 6.4% |
| Immigrants | Japan | 100.0 /100 | #22 | Exceptional 6.4% |
| Russians | 100.0 /100 | #23 | Exceptional 6.3% |
| Immigrants | Spain | 100.0 /100 | #24 | Exceptional 6.3% |
| Immigrants | Ireland | 100.0 /100 | #25 | Exceptional 6.3% |
| Latvians | 100.0 /100 | #26 | Exceptional 6.2% |
| Immigrants | Northern Europe | 100.0 /100 | #27 | Exceptional 6.2% |
| Turks | 100.0 /100 | #28 | Exceptional 6.2% |
| Immigrants | Sri Lanka | 100.0 /100 | #29 | Exceptional 6.2% |
| Immigrants | Turkey | 100.0 /100 | #30 | Exceptional 6.2% |
| Immigrants | India | 100.0 /100 | #31 | Exceptional 6.2% |
| Thais | 100.0 /100 | #32 | Exceptional 6.1% |
| Burmese | 100.0 /100 | #33 | Exceptional 6.1% |
| Mongolians | 100.0 /100 | #34 | Exceptional 6.1% |