Ottawa vs Immigrants from Liberia Associate's Degree
COMPARE
Ottawa
Immigrants from Liberia
Associate's Degree
Associate's Degree Comparison
Ottawa
Immigrants from Liberia
40.3%
ASSOCIATE'S DEGREE
0.1/ 100
METRIC RATING
278th/ 347
METRIC RANK
42.3%
ASSOCIATE'S DEGREE
0.9/ 100
METRIC RATING
244th/ 347
METRIC RANK
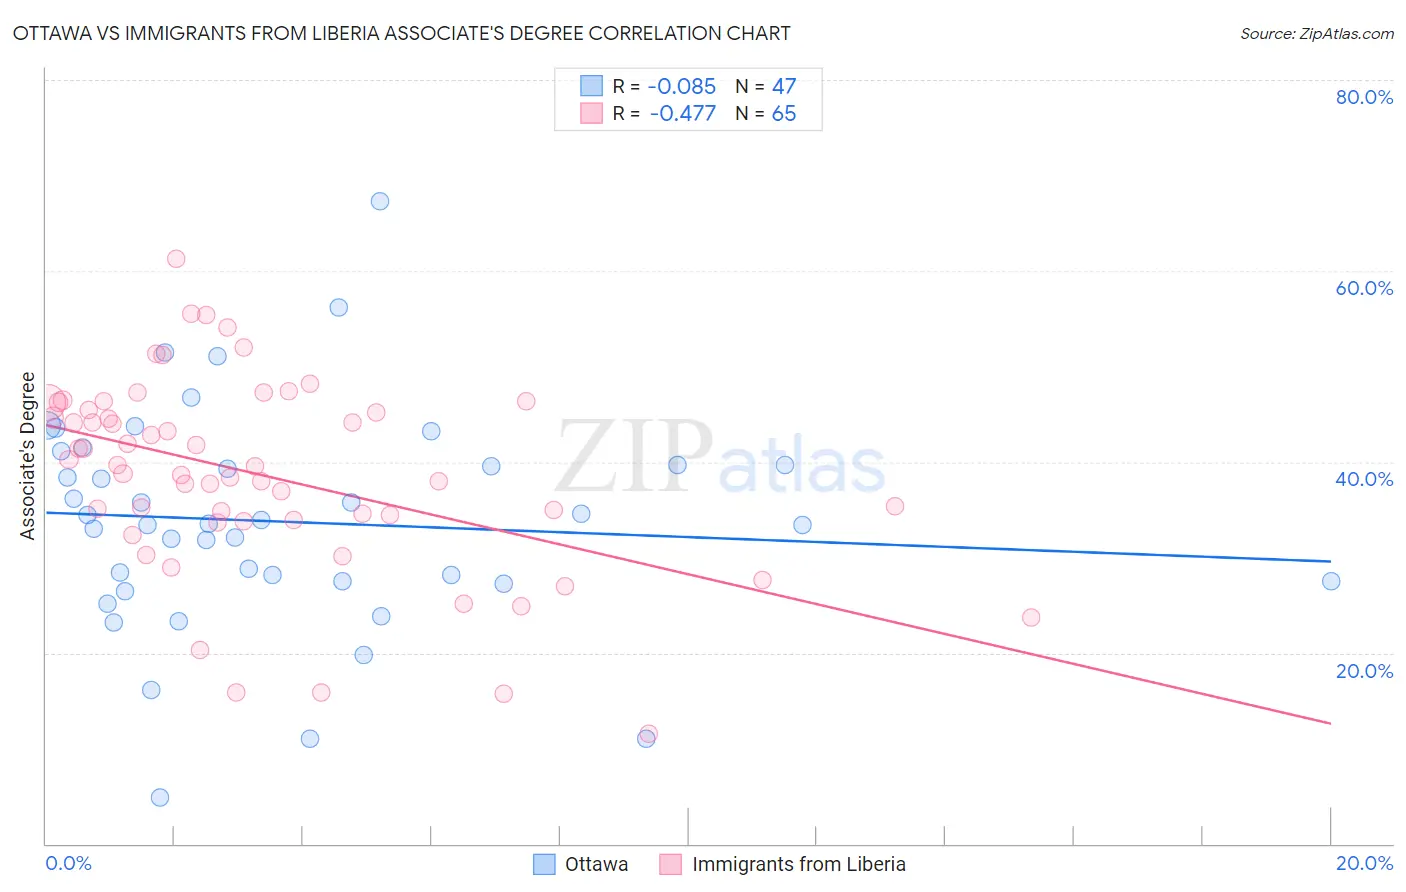
Ottawa vs Immigrants from Liberia Associate's Degree Correlation Chart
The statistical analysis conducted on geographies consisting of 49,956,602 people shows a slight negative correlation between the proportion of Ottawa and percentage of population with at least associate's degree education in the United States with a correlation coefficient (R) of -0.085 and weighted average of 40.3%. Similarly, the statistical analysis conducted on geographies consisting of 135,295,697 people shows a moderate negative correlation between the proportion of Immigrants from Liberia and percentage of population with at least associate's degree education in the United States with a correlation coefficient (R) of -0.477 and weighted average of 42.3%, a difference of 4.9%.
Associate's Degree Correlation Summary
| Measurement | Ottawa | Immigrants from Liberia |
| Minimum | 4.8% | 11.5% |
| Maximum | 67.2% | 61.3% |
| Range | 62.4% | 49.8% |
| Mean | 33.7% | 38.6% |
| Median | 33.5% | 39.5% |
| Interquartile 25% (IQ1) | 27.5% | 33.9% |
| Interquartile 75% (IQ3) | 39.7% | 45.8% |
| Interquartile Range (IQR) | 12.2% | 12.0% |
| Standard Deviation (Sample) | 11.6% | 10.2% |
| Standard Deviation (Population) | 11.5% | 10.2% |
Similar Demographics by Associate's Degree
Demographics Similar to Ottawa by Associate's Degree
In terms of associate's degree, the demographic groups most similar to Ottawa are Immigrants from Nicaragua (40.3%, a difference of 0.040%), Blackfeet (40.3%, a difference of 0.15%), Puerto Rican (40.4%, a difference of 0.20%), Immigrants from Micronesia (40.2%, a difference of 0.24%), and Potawatomi (40.4%, a difference of 0.30%).
| Demographics | Rating | Rank | Associate's Degree |
| Immigrants | Laos | 0.1 /100 | #271 | Tragic 40.7% |
| Belizeans | 0.1 /100 | #272 | Tragic 40.6% |
| Puget Sound Salish | 0.1 /100 | #273 | Tragic 40.5% |
| Immigrants | Dominica | 0.1 /100 | #274 | Tragic 40.5% |
| Potawatomi | 0.1 /100 | #275 | Tragic 40.4% |
| Puerto Ricans | 0.1 /100 | #276 | Tragic 40.4% |
| Blackfeet | 0.1 /100 | #277 | Tragic 40.3% |
| Ottawa | 0.1 /100 | #278 | Tragic 40.3% |
| Immigrants | Nicaragua | 0.1 /100 | #279 | Tragic 40.3% |
| Immigrants | Micronesia | 0.1 /100 | #280 | Tragic 40.2% |
| Immigrants | Portugal | 0.1 /100 | #281 | Tragic 40.1% |
| Bangladeshis | 0.1 /100 | #282 | Tragic 40.0% |
| Haitians | 0.1 /100 | #283 | Tragic 40.0% |
| Comanche | 0.1 /100 | #284 | Tragic 39.9% |
| Immigrants | Belize | 0.1 /100 | #285 | Tragic 39.9% |
Demographics Similar to Immigrants from Liberia by Associate's Degree
In terms of associate's degree, the demographic groups most similar to Immigrants from Liberia are Immigrants from Cambodia (42.3%, a difference of 0.020%), Delaware (42.3%, a difference of 0.050%), Guyanese (42.3%, a difference of 0.14%), Immigrants from Fiji (42.2%, a difference of 0.14%), and Immigrants from Ecuador (42.2%, a difference of 0.23%).
| Demographics | Rating | Rank | Associate's Degree |
| Immigrants | Nonimmigrants | 1.9 /100 | #237 | Tragic 42.9% |
| Iroquois | 1.7 /100 | #238 | Tragic 42.8% |
| Immigrants | Grenada | 1.3 /100 | #239 | Tragic 42.6% |
| Cree | 1.2 /100 | #240 | Tragic 42.5% |
| British West Indians | 1.0 /100 | #241 | Tragic 42.4% |
| Immigrants | West Indies | 1.0 /100 | #242 | Tragic 42.4% |
| Guyanese | 1.0 /100 | #243 | Tragic 42.3% |
| Immigrants | Liberia | 0.9 /100 | #244 | Tragic 42.3% |
| Immigrants | Cambodia | 0.9 /100 | #245 | Tragic 42.3% |
| Delaware | 0.9 /100 | #246 | Tragic 42.3% |
| Immigrants | Fiji | 0.8 /100 | #247 | Tragic 42.2% |
| Immigrants | Ecuador | 0.8 /100 | #248 | Tragic 42.2% |
| Jamaicans | 0.7 /100 | #249 | Tragic 42.1% |
| U.S. Virgin Islanders | 0.7 /100 | #250 | Tragic 42.1% |
| Immigrants | Bahamas | 0.7 /100 | #251 | Tragic 42.1% |