Ottawa vs Hawaiian Associate's Degree
COMPARE
Ottawa
Hawaiian
Associate's Degree
Associate's Degree Comparison
Ottawa
Hawaiians
40.3%
ASSOCIATE'S DEGREE
0.1/ 100
METRIC RATING
278th/ 347
METRIC RANK
40.9%
ASSOCIATE'S DEGREE
0.2/ 100
METRIC RATING
267th/ 347
METRIC RANK
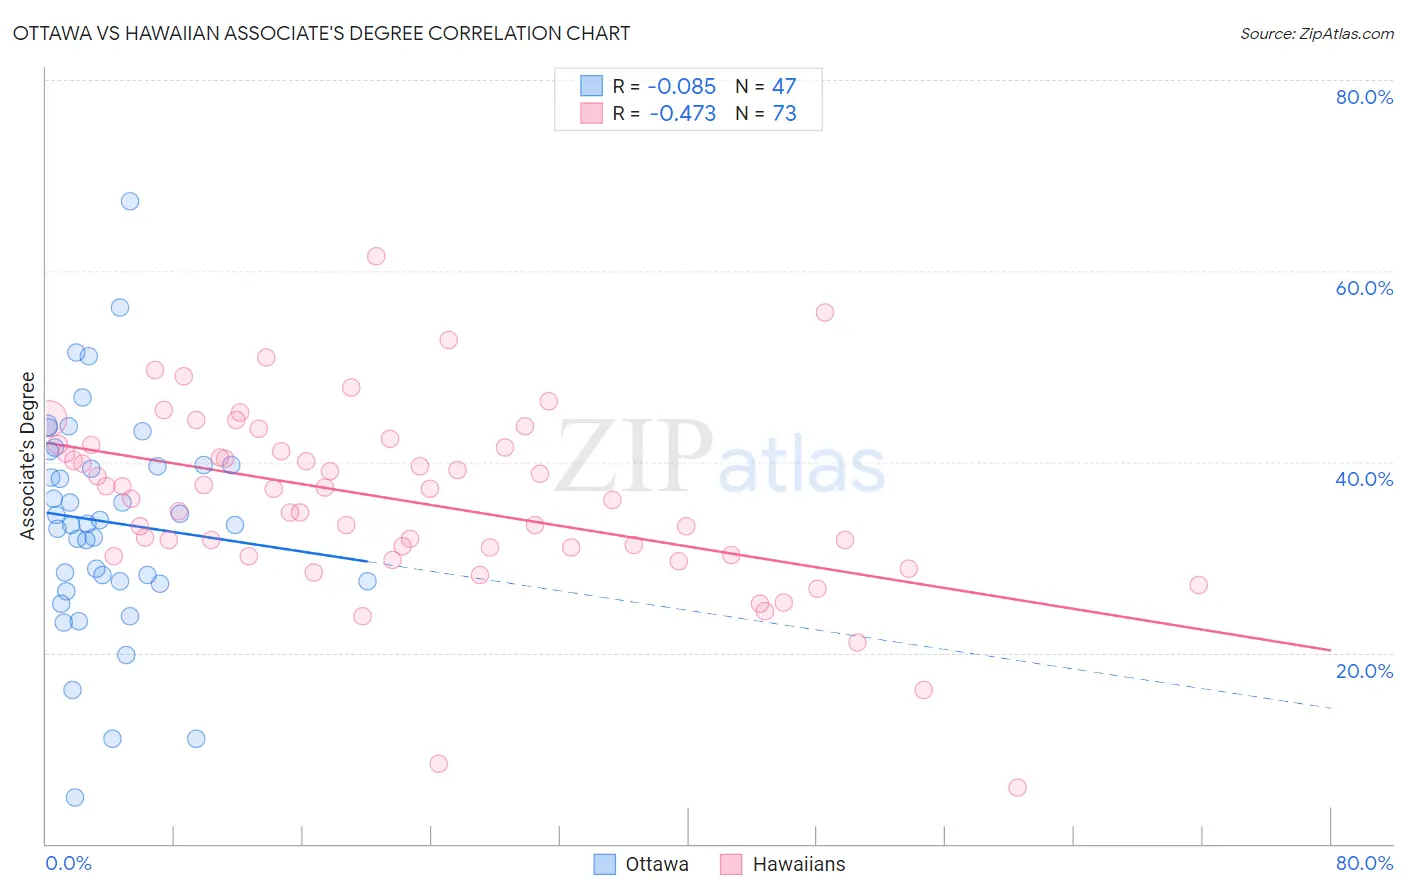
Ottawa vs Hawaiian Associate's Degree Correlation Chart
The statistical analysis conducted on geographies consisting of 49,956,602 people shows a slight negative correlation between the proportion of Ottawa and percentage of population with at least associate's degree education in the United States with a correlation coefficient (R) of -0.085 and weighted average of 40.3%. Similarly, the statistical analysis conducted on geographies consisting of 327,594,754 people shows a moderate negative correlation between the proportion of Hawaiians and percentage of population with at least associate's degree education in the United States with a correlation coefficient (R) of -0.473 and weighted average of 40.9%, a difference of 1.6%.
Associate's Degree Correlation Summary
| Measurement | Ottawa | Hawaiian |
| Minimum | 4.8% | 5.9% |
| Maximum | 67.2% | 61.5% |
| Range | 62.4% | 55.7% |
| Mean | 33.7% | 36.0% |
| Median | 33.5% | 37.2% |
| Interquartile 25% (IQ1) | 27.5% | 30.6% |
| Interquartile 75% (IQ3) | 39.7% | 41.7% |
| Interquartile Range (IQR) | 12.2% | 11.0% |
| Standard Deviation (Sample) | 11.6% | 9.5% |
| Standard Deviation (Population) | 11.5% | 9.4% |
Demographics Similar to Ottawa and Hawaiians by Associate's Degree
In terms of associate's degree, the demographic groups most similar to Ottawa are Immigrants from Nicaragua (40.3%, a difference of 0.040%), Blackfeet (40.3%, a difference of 0.15%), Puerto Rican (40.4%, a difference of 0.20%), Immigrants from Micronesia (40.2%, a difference of 0.24%), and Potawatomi (40.4%, a difference of 0.30%). Similarly, the demographic groups most similar to Hawaiians are Central American Indian (40.8%, a difference of 0.20%), American (40.8%, a difference of 0.38%), Chippewa (40.7%, a difference of 0.42%), African (41.1%, a difference of 0.56%), and Samoan (41.1%, a difference of 0.56%).
| Demographics | Rating | Rank | Associate's Degree |
| Bahamians | 0.4 /100 | #262 | Tragic 41.5% |
| Immigrants | Jamaica | 0.3 /100 | #263 | Tragic 41.5% |
| Osage | 0.3 /100 | #264 | Tragic 41.5% |
| Africans | 0.2 /100 | #265 | Tragic 41.1% |
| Samoans | 0.2 /100 | #266 | Tragic 41.1% |
| Hawaiians | 0.2 /100 | #267 | Tragic 40.9% |
| Central American Indians | 0.2 /100 | #268 | Tragic 40.8% |
| Americans | 0.2 /100 | #269 | Tragic 40.8% |
| Chippewa | 0.2 /100 | #270 | Tragic 40.7% |
| Immigrants | Laos | 0.1 /100 | #271 | Tragic 40.7% |
| Belizeans | 0.1 /100 | #272 | Tragic 40.6% |
| Puget Sound Salish | 0.1 /100 | #273 | Tragic 40.5% |
| Immigrants | Dominica | 0.1 /100 | #274 | Tragic 40.5% |
| Potawatomi | 0.1 /100 | #275 | Tragic 40.4% |
| Puerto Ricans | 0.1 /100 | #276 | Tragic 40.4% |
| Blackfeet | 0.1 /100 | #277 | Tragic 40.3% |
| Ottawa | 0.1 /100 | #278 | Tragic 40.3% |
| Immigrants | Nicaragua | 0.1 /100 | #279 | Tragic 40.3% |
| Immigrants | Micronesia | 0.1 /100 | #280 | Tragic 40.2% |
| Immigrants | Portugal | 0.1 /100 | #281 | Tragic 40.1% |
| Bangladeshis | 0.1 /100 | #282 | Tragic 40.0% |