Ottawa vs Immigrants from Central America Associate's Degree
COMPARE
Ottawa
Immigrants from Central America
Associate's Degree
Associate's Degree Comparison
Ottawa
Immigrants from Central America
40.3%
ASSOCIATE'S DEGREE
0.1/ 100
METRIC RATING
278th/ 347
METRIC RANK
35.0%
ASSOCIATE'S DEGREE
0.0/ 100
METRIC RATING
332nd/ 347
METRIC RANK
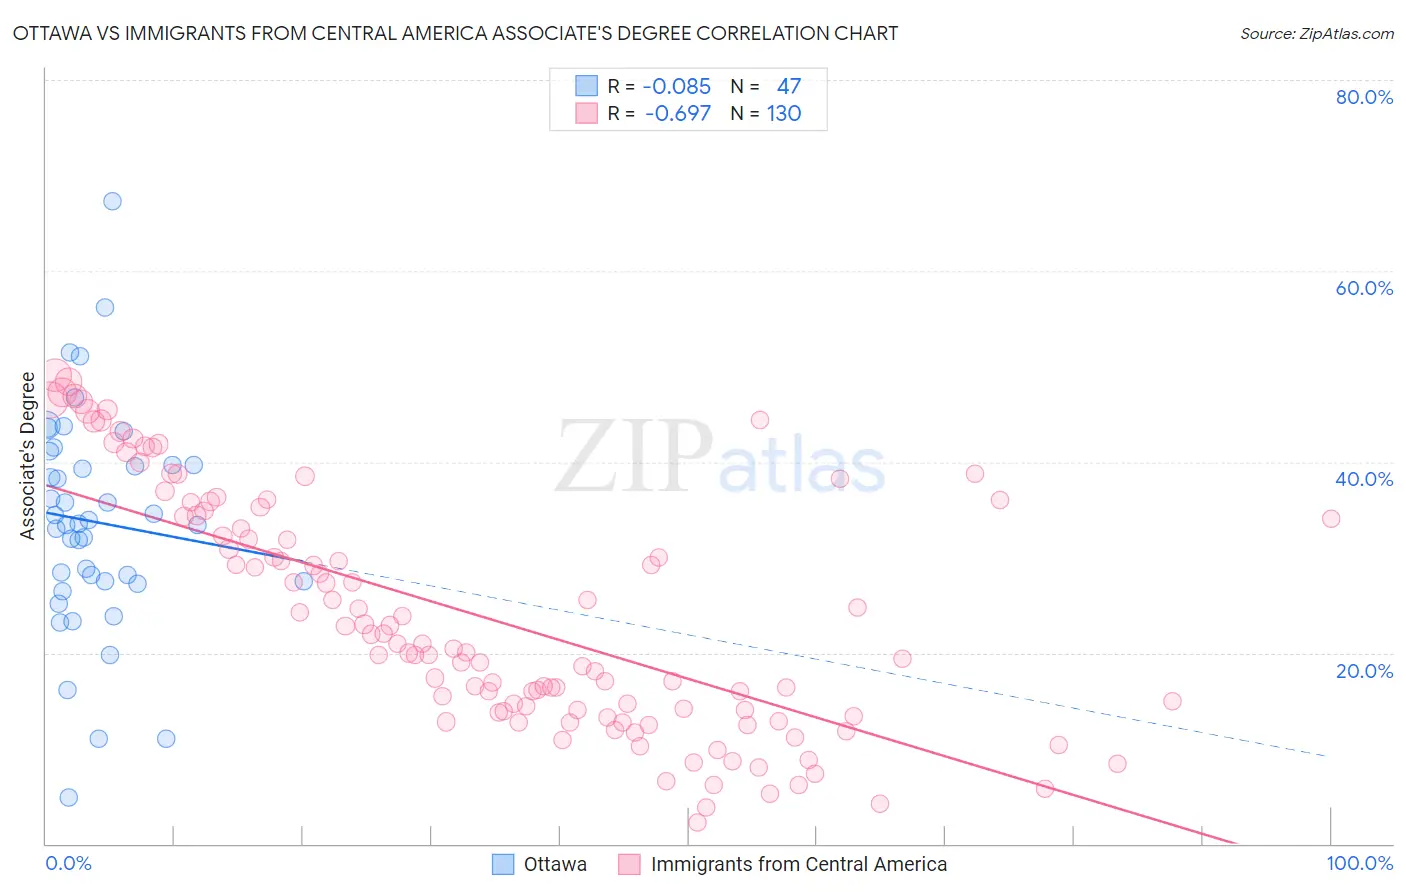
Ottawa vs Immigrants from Central America Associate's Degree Correlation Chart
The statistical analysis conducted on geographies consisting of 49,956,602 people shows a slight negative correlation between the proportion of Ottawa and percentage of population with at least associate's degree education in the United States with a correlation coefficient (R) of -0.085 and weighted average of 40.3%. Similarly, the statistical analysis conducted on geographies consisting of 536,468,789 people shows a significant negative correlation between the proportion of Immigrants from Central America and percentage of population with at least associate's degree education in the United States with a correlation coefficient (R) of -0.697 and weighted average of 35.0%, a difference of 15.0%.
Associate's Degree Correlation Summary
| Measurement | Ottawa | Immigrants from Central America |
| Minimum | 4.8% | 2.2% |
| Maximum | 67.2% | 49.1% |
| Range | 62.4% | 46.9% |
| Mean | 33.7% | 23.8% |
| Median | 33.5% | 20.7% |
| Interquartile 25% (IQ1) | 27.5% | 13.9% |
| Interquartile 75% (IQ3) | 39.7% | 34.4% |
| Interquartile Range (IQR) | 12.2% | 20.5% |
| Standard Deviation (Sample) | 11.6% | 12.4% |
| Standard Deviation (Population) | 11.5% | 12.4% |
Similar Demographics by Associate's Degree
Demographics Similar to Ottawa by Associate's Degree
In terms of associate's degree, the demographic groups most similar to Ottawa are Immigrants from Nicaragua (40.3%, a difference of 0.040%), Blackfeet (40.3%, a difference of 0.15%), Puerto Rican (40.4%, a difference of 0.20%), Immigrants from Micronesia (40.2%, a difference of 0.24%), and Potawatomi (40.4%, a difference of 0.30%).
| Demographics | Rating | Rank | Associate's Degree |
| Immigrants | Laos | 0.1 /100 | #271 | Tragic 40.7% |
| Belizeans | 0.1 /100 | #272 | Tragic 40.6% |
| Puget Sound Salish | 0.1 /100 | #273 | Tragic 40.5% |
| Immigrants | Dominica | 0.1 /100 | #274 | Tragic 40.5% |
| Potawatomi | 0.1 /100 | #275 | Tragic 40.4% |
| Puerto Ricans | 0.1 /100 | #276 | Tragic 40.4% |
| Blackfeet | 0.1 /100 | #277 | Tragic 40.3% |
| Ottawa | 0.1 /100 | #278 | Tragic 40.3% |
| Immigrants | Nicaragua | 0.1 /100 | #279 | Tragic 40.3% |
| Immigrants | Micronesia | 0.1 /100 | #280 | Tragic 40.2% |
| Immigrants | Portugal | 0.1 /100 | #281 | Tragic 40.1% |
| Bangladeshis | 0.1 /100 | #282 | Tragic 40.0% |
| Haitians | 0.1 /100 | #283 | Tragic 40.0% |
| Comanche | 0.1 /100 | #284 | Tragic 39.9% |
| Immigrants | Belize | 0.1 /100 | #285 | Tragic 39.9% |
Demographics Similar to Immigrants from Central America by Associate's Degree
In terms of associate's degree, the demographic groups most similar to Immigrants from Central America are Mexican (35.0%, a difference of 0.080%), Native/Alaskan (34.9%, a difference of 0.31%), Spanish American Indian (34.9%, a difference of 0.45%), Hopi (34.6%, a difference of 1.3%), and Immigrants from the Azores (35.6%, a difference of 1.8%).
| Demographics | Rating | Rank | Associate's Degree |
| Menominee | 0.0 /100 | #325 | Tragic 36.7% |
| Kiowa | 0.0 /100 | #326 | Tragic 36.5% |
| Dutch West Indians | 0.0 /100 | #327 | Tragic 36.5% |
| Alaskan Athabascans | 0.0 /100 | #328 | Tragic 36.5% |
| Paiute | 0.0 /100 | #329 | Tragic 36.4% |
| Apache | 0.0 /100 | #330 | Tragic 36.2% |
| Immigrants | Azores | 0.0 /100 | #331 | Tragic 35.6% |
| Immigrants | Central America | 0.0 /100 | #332 | Tragic 35.0% |
| Mexicans | 0.0 /100 | #333 | Tragic 35.0% |
| Natives/Alaskans | 0.0 /100 | #334 | Tragic 34.9% |
| Spanish American Indians | 0.0 /100 | #335 | Tragic 34.9% |
| Hopi | 0.0 /100 | #336 | Tragic 34.6% |
| Lumbee | 0.0 /100 | #337 | Tragic 34.1% |
| Pueblo | 0.0 /100 | #338 | Tragic 34.0% |
| Immigrants | Mexico | 0.0 /100 | #339 | Tragic 33.7% |