Ottawa vs Immigrants from Liberia 7th Grade
COMPARE
Ottawa
Immigrants from Liberia
7th Grade
7th Grade Comparison
Ottawa
Immigrants from Liberia
98.1%
7TH GRADE
100.0/ 100
METRIC RATING
4th/ 347
METRIC RANK
95.7%
7TH GRADE
8.1/ 100
METRIC RATING
218th/ 347
METRIC RANK
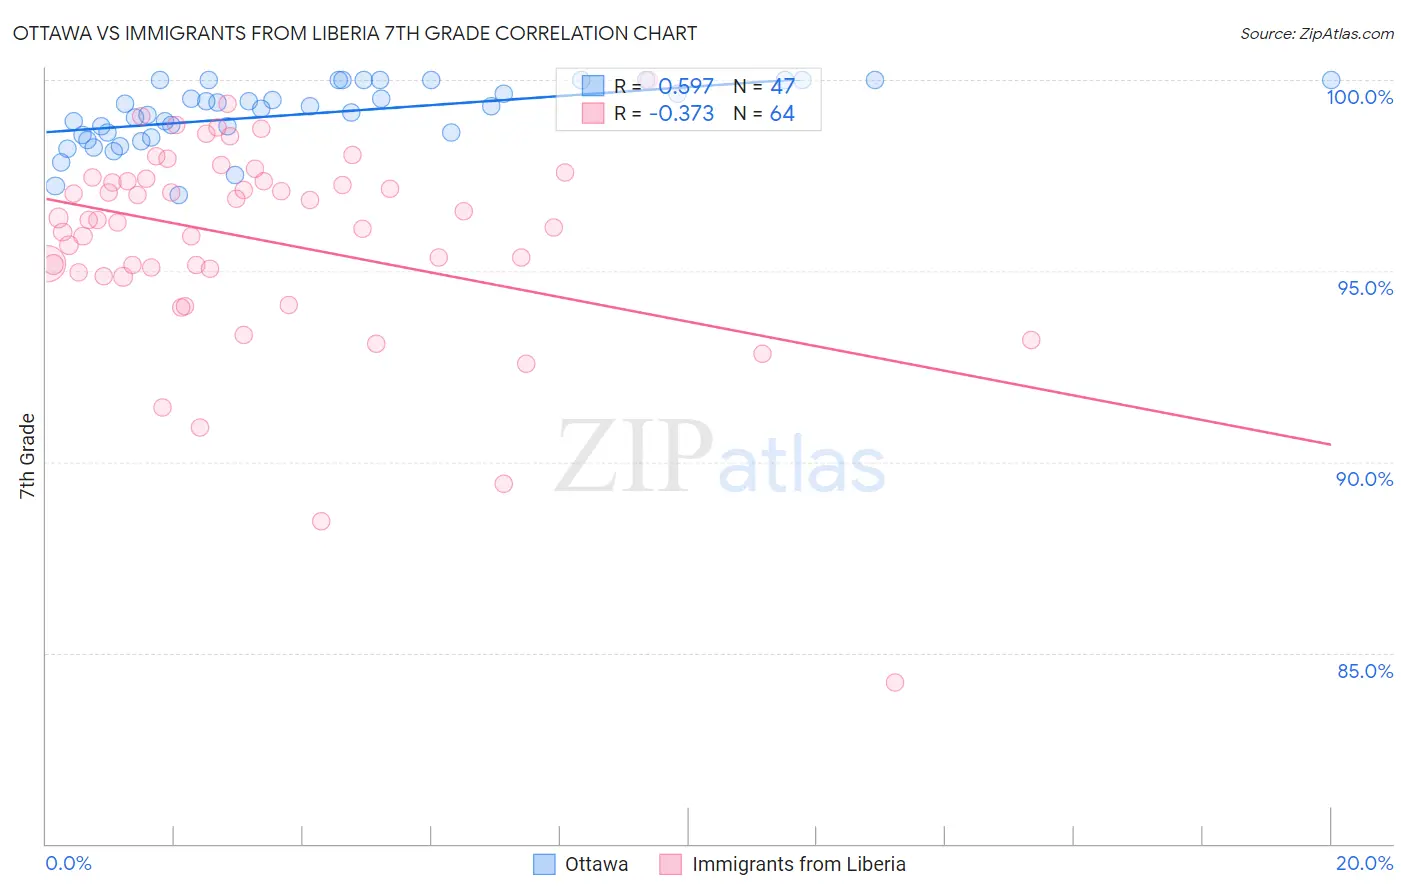
Ottawa vs Immigrants from Liberia 7th Grade Correlation Chart
The statistical analysis conducted on geographies consisting of 4,824,405 people shows a substantial positive correlation between the proportion of Ottawa and percentage of population with at least 7th grade education in the United States with a correlation coefficient (R) of 0.597 and weighted average of 98.1%. Similarly, the statistical analysis conducted on geographies consisting of 135,294,272 people shows a mild negative correlation between the proportion of Immigrants from Liberia and percentage of population with at least 7th grade education in the United States with a correlation coefficient (R) of -0.373 and weighted average of 95.7%, a difference of 2.6%.
7th Grade Correlation Summary
| Measurement | Ottawa | Immigrants from Liberia |
| Minimum | 97.0% | 84.2% |
| Maximum | 100.0% | 100.0% |
| Range | 3.0% | 15.8% |
| Mean | 99.1% | 95.8% |
| Median | 99.3% | 96.3% |
| Interquartile 25% (IQ1) | 98.5% | 95.0% |
| Interquartile 75% (IQ3) | 100.0% | 97.4% |
| Interquartile Range (IQR) | 1.5% | 2.4% |
| Standard Deviation (Sample) | 0.80% | 2.7% |
| Standard Deviation (Population) | 0.79% | 2.7% |
Similar Demographics by 7th Grade
Demographics Similar to Ottawa by 7th Grade
In terms of 7th grade, the demographic groups most similar to Ottawa are Carpatho Rusyn (98.3%, a difference of 0.20%), Dutch (97.9%, a difference of 0.27%), Tsimshian (97.8%, a difference of 0.33%), Norwegian (97.8%, a difference of 0.36%), and Finnish (98.5%, a difference of 0.37%).
| Demographics | Rating | Rank | 7th Grade |
| Crow | 100.0 /100 | #1 | Exceptional 99.1% |
| Finns | 100.0 /100 | #2 | Exceptional 98.5% |
| Carpatho Rusyns | 100.0 /100 | #3 | Exceptional 98.3% |
| Ottawa | 100.0 /100 | #4 | Exceptional 98.1% |
| Dutch | 100.0 /100 | #5 | Exceptional 97.9% |
| Tsimshian | 100.0 /100 | #6 | Exceptional 97.8% |
| Norwegians | 100.0 /100 | #7 | Exceptional 97.8% |
| Slovaks | 100.0 /100 | #8 | Exceptional 97.8% |
| Germans | 100.0 /100 | #9 | Exceptional 97.7% |
| Slovenes | 100.0 /100 | #10 | Exceptional 97.6% |
| Alaskan Athabascans | 100.0 /100 | #11 | Exceptional 97.6% |
| Poles | 100.0 /100 | #12 | Exceptional 97.6% |
| Swedes | 100.0 /100 | #13 | Exceptional 97.6% |
| Pennsylvania Germans | 100.0 /100 | #14 | Exceptional 97.6% |
| English | 100.0 /100 | #15 | Exceptional 97.6% |
Demographics Similar to Immigrants from Liberia by 7th Grade
In terms of 7th grade, the demographic groups most similar to Immigrants from Liberia are Immigrants from Southern Europe (95.7%, a difference of 0.0%), Spanish American (95.7%, a difference of 0.020%), Immigrants from Chile (95.7%, a difference of 0.020%), Immigrants from Pakistan (95.7%, a difference of 0.020%), and Subsaharan African (95.7%, a difference of 0.020%).
| Demographics | Rating | Rank | 7th Grade |
| Portuguese | 13.6 /100 | #211 | Poor 95.8% |
| Immigrants | Lebanon | 13.0 /100 | #212 | Poor 95.8% |
| Immigrants | Morocco | 12.6 /100 | #213 | Poor 95.8% |
| Bahamians | 11.6 /100 | #214 | Poor 95.7% |
| Spanish Americans | 9.3 /100 | #215 | Tragic 95.7% |
| Immigrants | Chile | 9.1 /100 | #216 | Tragic 95.7% |
| Immigrants | Pakistan | 9.0 /100 | #217 | Tragic 95.7% |
| Immigrants | Liberia | 8.1 /100 | #218 | Tragic 95.7% |
| Immigrants | Southern Europe | 7.9 /100 | #219 | Tragic 95.7% |
| Sub-Saharan Africans | 7.2 /100 | #220 | Tragic 95.7% |
| Samoans | 7.0 /100 | #221 | Tragic 95.7% |
| Laotians | 6.8 /100 | #222 | Tragic 95.7% |
| Immigrants | Syria | 6.7 /100 | #223 | Tragic 95.7% |
| Immigrants | Oceania | 6.7 /100 | #224 | Tragic 95.7% |
| Immigrants | Malaysia | 6.2 /100 | #225 | Tragic 95.6% |