Ottawa vs Bermudan College, 1 year or more
COMPARE
Ottawa
Bermudan
College, 1 year or more
College, 1 year or more Comparison
Ottawa
Bermudans
54.9%
COLLEGE, 1 YEAR OR MORE
0.3/ 100
METRIC RATING
261st/ 347
METRIC RANK
59.3%
COLLEGE, 1 YEAR OR MORE
46.6/ 100
METRIC RATING
179th/ 347
METRIC RANK
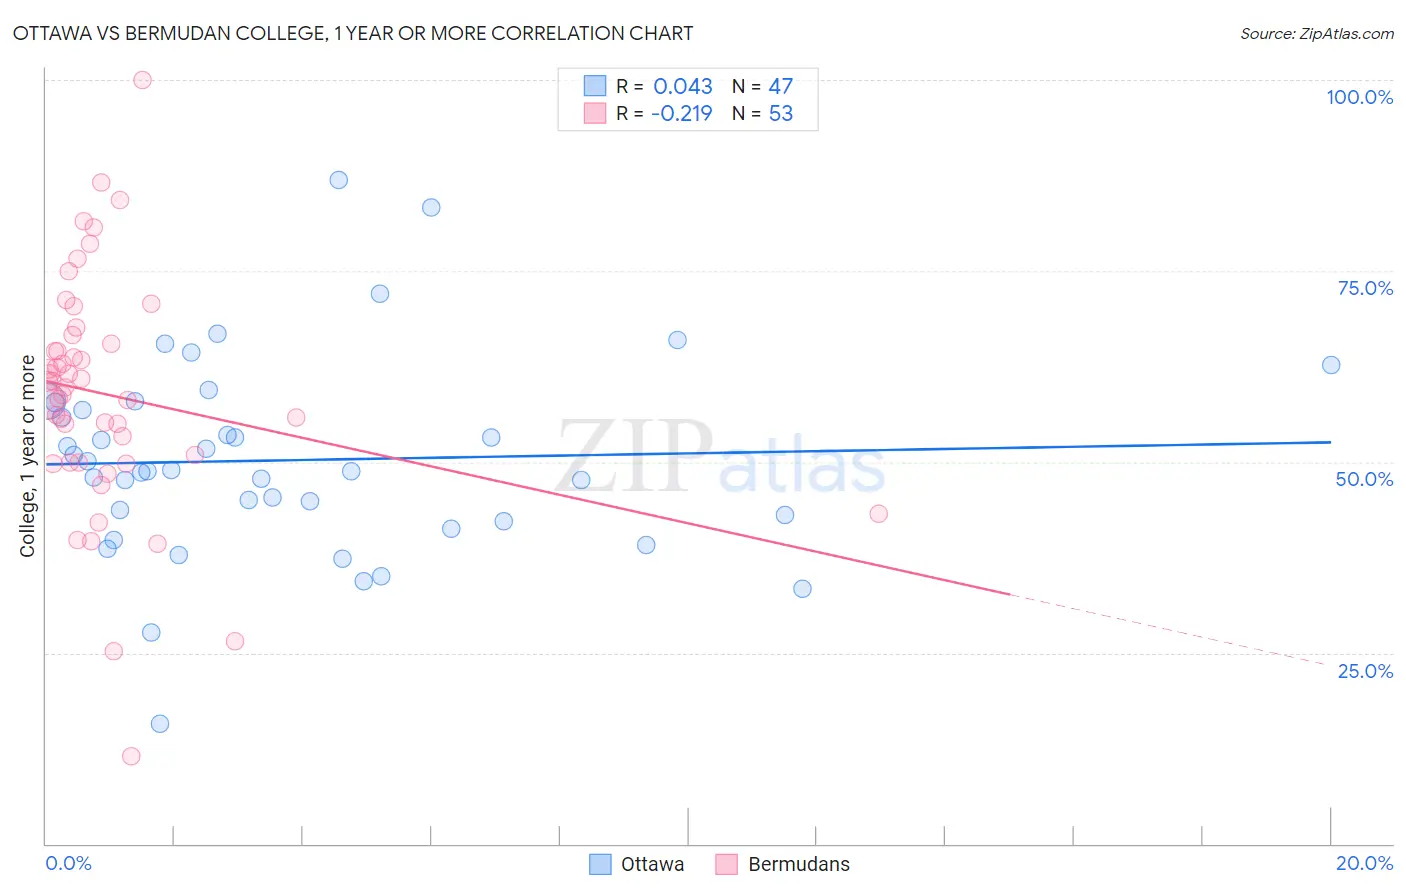
Ottawa vs Bermudan College, 1 year or more Correlation Chart
The statistical analysis conducted on geographies consisting of 49,956,602 people shows no correlation between the proportion of Ottawa and percentage of population with at least college, 1 year or more education in the United States with a correlation coefficient (R) of 0.043 and weighted average of 54.9%. Similarly, the statistical analysis conducted on geographies consisting of 55,732,793 people shows a weak negative correlation between the proportion of Bermudans and percentage of population with at least college, 1 year or more education in the United States with a correlation coefficient (R) of -0.219 and weighted average of 59.3%, a difference of 8.1%.
College, 1 year or more Correlation Summary
| Measurement | Ottawa | Bermudan |
| Minimum | 15.7% | 11.4% |
| Maximum | 86.9% | 100.0% |
| Range | 71.3% | 88.6% |
| Mean | 50.2% | 58.8% |
| Median | 48.8% | 59.8% |
| Interquartile 25% (IQ1) | 42.2% | 49.9% |
| Interquartile 75% (IQ3) | 57.7% | 66.0% |
| Interquartile Range (IQR) | 15.5% | 16.1% |
| Standard Deviation (Sample) | 13.1% | 15.6% |
| Standard Deviation (Population) | 13.0% | 15.5% |
Similar Demographics by College, 1 year or more
Demographics Similar to Ottawa by College, 1 year or more
In terms of college, 1 year or more, the demographic groups most similar to Ottawa are Jamaican (54.9%, a difference of 0.030%), Immigrants from St. Vincent and the Grenadines (54.8%, a difference of 0.080%), U.S. Virgin Islander (54.8%, a difference of 0.11%), Nepalese (54.9%, a difference of 0.13%), and Immigrants from Micronesia (54.8%, a difference of 0.13%).
| Demographics | Rating | Rank | College, 1 year or more |
| Japanese | 0.5 /100 | #254 | Tragic 55.2% |
| Immigrants | Bahamas | 0.5 /100 | #255 | Tragic 55.2% |
| Immigrants | West Indies | 0.5 /100 | #256 | Tragic 55.2% |
| Indonesians | 0.4 /100 | #257 | Tragic 55.1% |
| Africans | 0.4 /100 | #258 | Tragic 55.0% |
| Nepalese | 0.3 /100 | #259 | Tragic 54.9% |
| Jamaicans | 0.3 /100 | #260 | Tragic 54.9% |
| Ottawa | 0.3 /100 | #261 | Tragic 54.9% |
| Immigrants | St. Vincent and the Grenadines | 0.3 /100 | #262 | Tragic 54.8% |
| U.S. Virgin Islanders | 0.3 /100 | #263 | Tragic 54.8% |
| Immigrants | Micronesia | 0.3 /100 | #264 | Tragic 54.8% |
| Immigrants | Laos | 0.2 /100 | #265 | Tragic 54.7% |
| Potawatomi | 0.2 /100 | #266 | Tragic 54.6% |
| Blackfeet | 0.2 /100 | #267 | Tragic 54.6% |
| British West Indians | 0.2 /100 | #268 | Tragic 54.5% |
Demographics Similar to Bermudans by College, 1 year or more
In terms of college, 1 year or more, the demographic groups most similar to Bermudans are Czechoslovakian (59.4%, a difference of 0.090%), Tlingit-Haida (59.4%, a difference of 0.10%), Immigrants from Poland (59.4%, a difference of 0.12%), Sri Lankan (59.4%, a difference of 0.13%), and Yugoslavian (59.2%, a difference of 0.14%).
| Demographics | Rating | Rank | College, 1 year or more |
| Immigrants | Sierra Leone | 52.2 /100 | #172 | Average 59.5% |
| Immigrants | Oceania | 51.2 /100 | #173 | Average 59.4% |
| Celtics | 50.0 /100 | #174 | Average 59.4% |
| Sri Lankans | 49.0 /100 | #175 | Average 59.4% |
| Immigrants | Poland | 48.9 /100 | #176 | Average 59.4% |
| Tlingit-Haida | 48.4 /100 | #177 | Average 59.4% |
| Czechoslovakians | 48.3 /100 | #178 | Average 59.4% |
| Bermudans | 46.6 /100 | #179 | Average 59.3% |
| Yugoslavians | 44.1 /100 | #180 | Average 59.2% |
| Swiss | 43.4 /100 | #181 | Average 59.2% |
| Immigrants | Bosnia and Herzegovina | 42.8 /100 | #182 | Average 59.2% |
| German Russians | 39.3 /100 | #183 | Fair 59.1% |
| Spaniards | 38.3 /100 | #184 | Fair 59.0% |
| South Americans | 35.9 /100 | #185 | Fair 59.0% |
| Scotch-Irish | 34.7 /100 | #186 | Fair 58.9% |