Ottawa vs Armenian College, 1 year or more
COMPARE
Ottawa
Armenian
College, 1 year or more
College, 1 year or more Comparison
Ottawa
Armenians
54.9%
COLLEGE, 1 YEAR OR MORE
0.3/ 100
METRIC RATING
261st/ 347
METRIC RANK
63.0%
COLLEGE, 1 YEAR OR MORE
98.9/ 100
METRIC RATING
75th/ 347
METRIC RANK
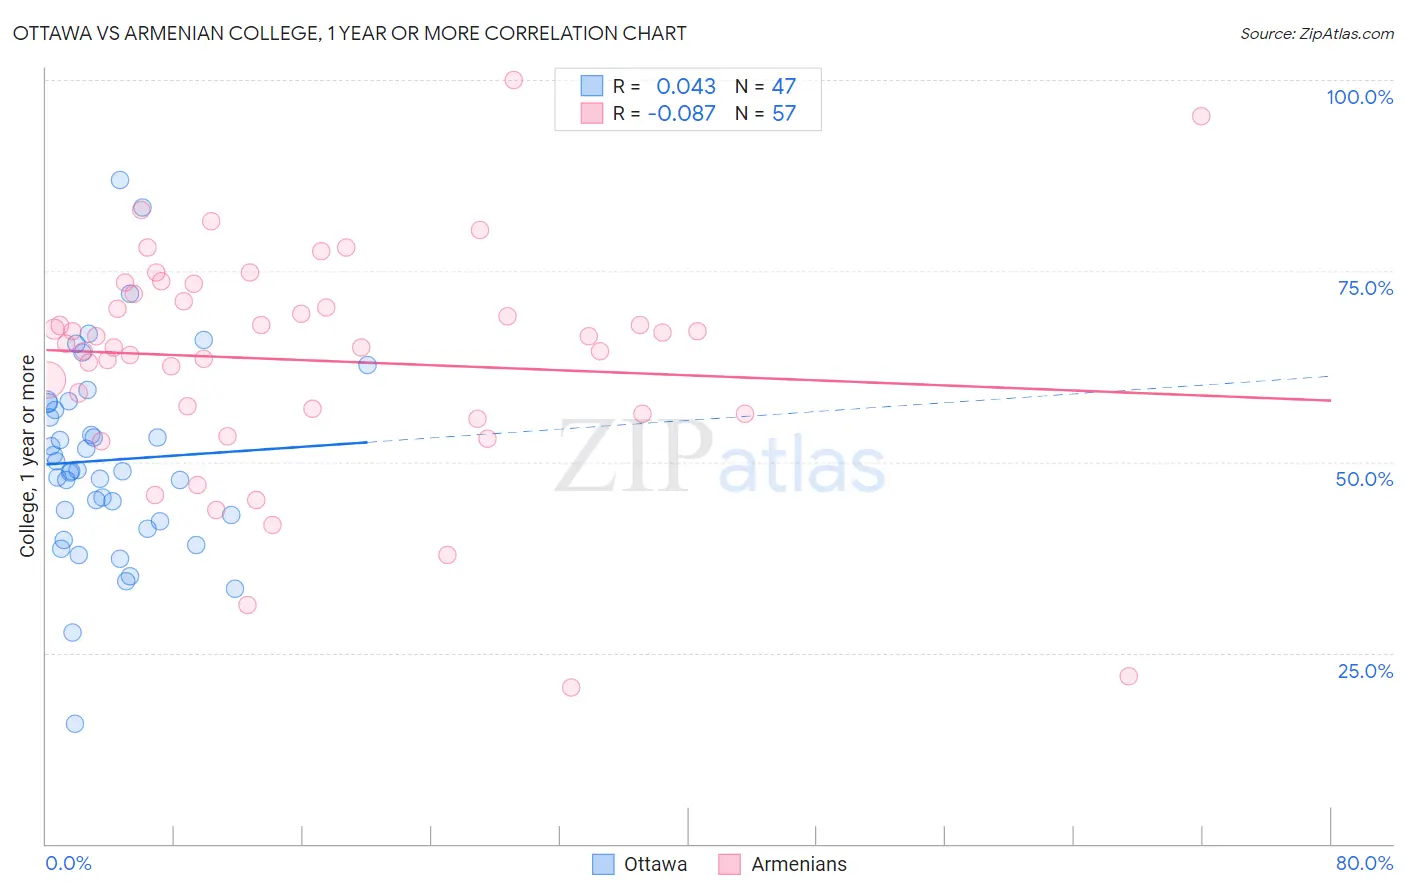
Ottawa vs Armenian College, 1 year or more Correlation Chart
The statistical analysis conducted on geographies consisting of 49,956,602 people shows no correlation between the proportion of Ottawa and percentage of population with at least college, 1 year or more education in the United States with a correlation coefficient (R) of 0.043 and weighted average of 54.9%. Similarly, the statistical analysis conducted on geographies consisting of 310,952,439 people shows a slight negative correlation between the proportion of Armenians and percentage of population with at least college, 1 year or more education in the United States with a correlation coefficient (R) of -0.087 and weighted average of 63.0%, a difference of 14.8%.
College, 1 year or more Correlation Summary
| Measurement | Ottawa | Armenian |
| Minimum | 15.7% | 20.5% |
| Maximum | 86.9% | 100.0% |
| Range | 71.3% | 79.5% |
| Mean | 50.2% | 63.3% |
| Median | 48.8% | 65.4% |
| Interquartile 25% (IQ1) | 42.2% | 56.3% |
| Interquartile 75% (IQ3) | 57.7% | 71.5% |
| Interquartile Range (IQR) | 15.5% | 15.2% |
| Standard Deviation (Sample) | 13.1% | 15.0% |
| Standard Deviation (Population) | 13.0% | 14.9% |
Similar Demographics by College, 1 year or more
Demographics Similar to Ottawa by College, 1 year or more
In terms of college, 1 year or more, the demographic groups most similar to Ottawa are Jamaican (54.9%, a difference of 0.030%), Immigrants from St. Vincent and the Grenadines (54.8%, a difference of 0.080%), U.S. Virgin Islander (54.8%, a difference of 0.11%), Nepalese (54.9%, a difference of 0.13%), and Immigrants from Micronesia (54.8%, a difference of 0.13%).
| Demographics | Rating | Rank | College, 1 year or more |
| Japanese | 0.5 /100 | #254 | Tragic 55.2% |
| Immigrants | Bahamas | 0.5 /100 | #255 | Tragic 55.2% |
| Immigrants | West Indies | 0.5 /100 | #256 | Tragic 55.2% |
| Indonesians | 0.4 /100 | #257 | Tragic 55.1% |
| Africans | 0.4 /100 | #258 | Tragic 55.0% |
| Nepalese | 0.3 /100 | #259 | Tragic 54.9% |
| Jamaicans | 0.3 /100 | #260 | Tragic 54.9% |
| Ottawa | 0.3 /100 | #261 | Tragic 54.9% |
| Immigrants | St. Vincent and the Grenadines | 0.3 /100 | #262 | Tragic 54.8% |
| U.S. Virgin Islanders | 0.3 /100 | #263 | Tragic 54.8% |
| Immigrants | Micronesia | 0.3 /100 | #264 | Tragic 54.8% |
| Immigrants | Laos | 0.2 /100 | #265 | Tragic 54.7% |
| Potawatomi | 0.2 /100 | #266 | Tragic 54.6% |
| Blackfeet | 0.2 /100 | #267 | Tragic 54.6% |
| British West Indians | 0.2 /100 | #268 | Tragic 54.5% |
Demographics Similar to Armenians by College, 1 year or more
In terms of college, 1 year or more, the demographic groups most similar to Armenians are Immigrants from North America (63.0%, a difference of 0.090%), Paraguayan (62.9%, a difference of 0.10%), Ethiopian (62.9%, a difference of 0.10%), Immigrants from Moldova (63.0%, a difference of 0.11%), and Egyptian (63.1%, a difference of 0.12%).
| Demographics | Rating | Rank | College, 1 year or more |
| Immigrants | Greece | 99.3 /100 | #68 | Exceptional 63.3% |
| Immigrants | Zimbabwe | 99.3 /100 | #69 | Exceptional 63.3% |
| Argentineans | 99.2 /100 | #70 | Exceptional 63.2% |
| Immigrants | Canada | 99.1 /100 | #71 | Exceptional 63.1% |
| Egyptians | 99.0 /100 | #72 | Exceptional 63.1% |
| Immigrants | Moldova | 99.0 /100 | #73 | Exceptional 63.0% |
| Immigrants | North America | 99.0 /100 | #74 | Exceptional 63.0% |
| Armenians | 98.9 /100 | #75 | Exceptional 63.0% |
| Paraguayans | 98.8 /100 | #76 | Exceptional 62.9% |
| Ethiopians | 98.8 /100 | #77 | Exceptional 62.9% |
| Immigrants | Lebanon | 98.8 /100 | #78 | Exceptional 62.9% |
| Northern Europeans | 98.8 /100 | #79 | Exceptional 62.9% |
| Lithuanians | 98.8 /100 | #80 | Exceptional 62.9% |
| Laotians | 98.7 /100 | #81 | Exceptional 62.8% |
| Immigrants | Bolivia | 98.7 /100 | #82 | Exceptional 62.8% |