Ottawa vs Nicaraguan College, 1 year or more
COMPARE
Ottawa
Nicaraguan
College, 1 year or more
College, 1 year or more Comparison
Ottawa
Nicaraguans
54.9%
COLLEGE, 1 YEAR OR MORE
0.3/ 100
METRIC RATING
261st/ 347
METRIC RANK
53.9%
COLLEGE, 1 YEAR OR MORE
0.1/ 100
METRIC RATING
283rd/ 347
METRIC RANK
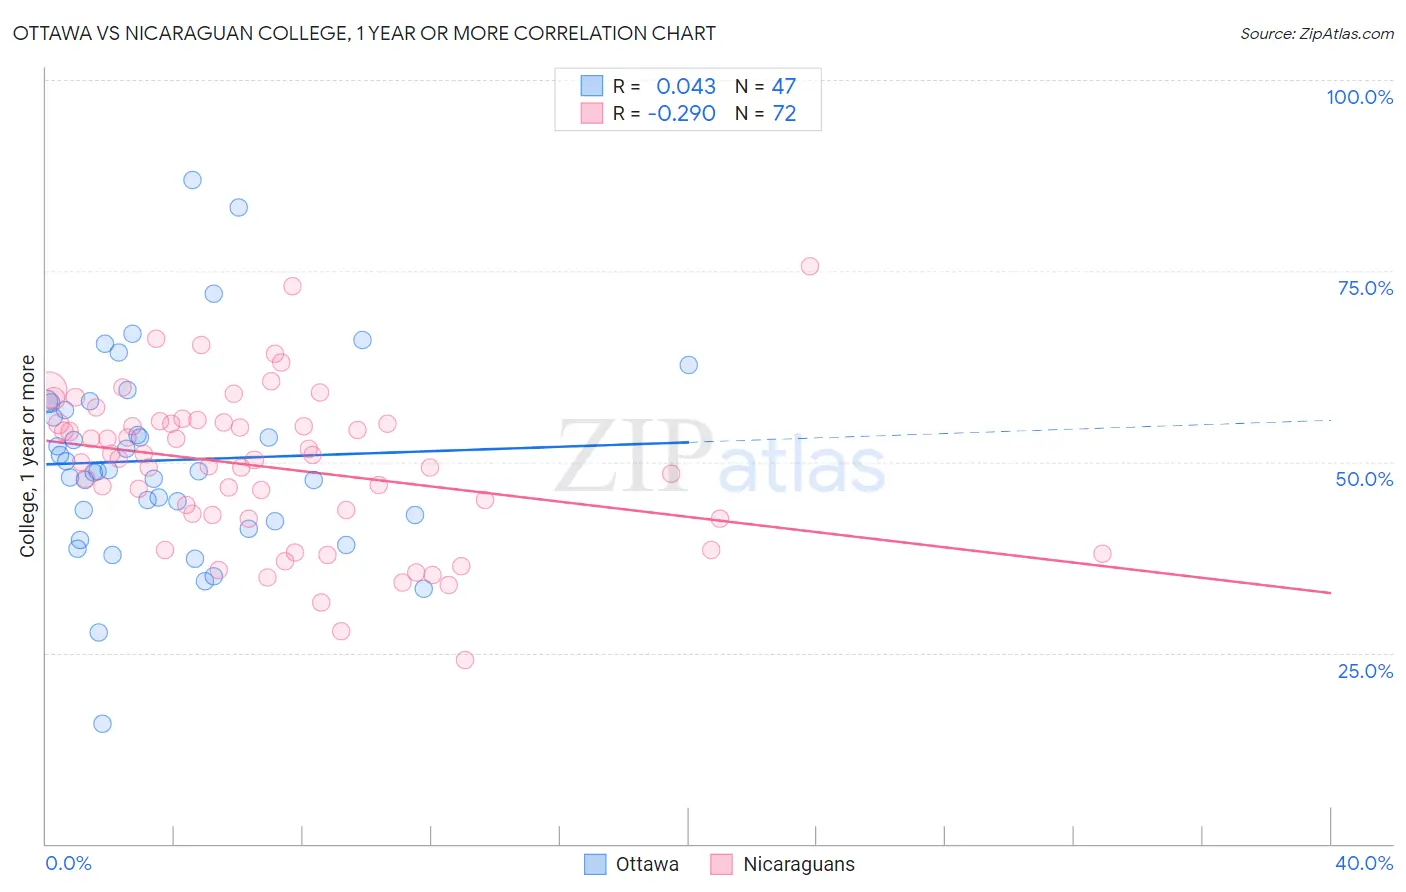
Ottawa vs Nicaraguan College, 1 year or more Correlation Chart
The statistical analysis conducted on geographies consisting of 49,956,602 people shows no correlation between the proportion of Ottawa and percentage of population with at least college, 1 year or more education in the United States with a correlation coefficient (R) of 0.043 and weighted average of 54.9%. Similarly, the statistical analysis conducted on geographies consisting of 285,711,182 people shows a weak negative correlation between the proportion of Nicaraguans and percentage of population with at least college, 1 year or more education in the United States with a correlation coefficient (R) of -0.290 and weighted average of 53.9%, a difference of 1.8%.
College, 1 year or more Correlation Summary
| Measurement | Ottawa | Nicaraguan |
| Minimum | 15.7% | 24.0% |
| Maximum | 86.9% | 75.6% |
| Range | 71.3% | 51.6% |
| Mean | 50.2% | 49.3% |
| Median | 48.8% | 50.3% |
| Interquartile 25% (IQ1) | 42.2% | 42.8% |
| Interquartile 75% (IQ3) | 57.7% | 55.1% |
| Interquartile Range (IQR) | 15.5% | 12.3% |
| Standard Deviation (Sample) | 13.1% | 10.1% |
| Standard Deviation (Population) | 13.0% | 10.1% |
Similar Demographics by College, 1 year or more
Demographics Similar to Ottawa by College, 1 year or more
In terms of college, 1 year or more, the demographic groups most similar to Ottawa are Jamaican (54.9%, a difference of 0.030%), Immigrants from St. Vincent and the Grenadines (54.8%, a difference of 0.080%), U.S. Virgin Islander (54.8%, a difference of 0.11%), Nepalese (54.9%, a difference of 0.13%), and Immigrants from Micronesia (54.8%, a difference of 0.13%).
| Demographics | Rating | Rank | College, 1 year or more |
| Japanese | 0.5 /100 | #254 | Tragic 55.2% |
| Immigrants | Bahamas | 0.5 /100 | #255 | Tragic 55.2% |
| Immigrants | West Indies | 0.5 /100 | #256 | Tragic 55.2% |
| Indonesians | 0.4 /100 | #257 | Tragic 55.1% |
| Africans | 0.4 /100 | #258 | Tragic 55.0% |
| Nepalese | 0.3 /100 | #259 | Tragic 54.9% |
| Jamaicans | 0.3 /100 | #260 | Tragic 54.9% |
| Ottawa | 0.3 /100 | #261 | Tragic 54.9% |
| Immigrants | St. Vincent and the Grenadines | 0.3 /100 | #262 | Tragic 54.8% |
| U.S. Virgin Islanders | 0.3 /100 | #263 | Tragic 54.8% |
| Immigrants | Micronesia | 0.3 /100 | #264 | Tragic 54.8% |
| Immigrants | Laos | 0.2 /100 | #265 | Tragic 54.7% |
| Potawatomi | 0.2 /100 | #266 | Tragic 54.6% |
| Blackfeet | 0.2 /100 | #267 | Tragic 54.6% |
| British West Indians | 0.2 /100 | #268 | Tragic 54.5% |
Demographics Similar to Nicaraguans by College, 1 year or more
In terms of college, 1 year or more, the demographic groups most similar to Nicaraguans are Ute (53.8%, a difference of 0.17%), Guyanese (54.1%, a difference of 0.36%), Colville (54.1%, a difference of 0.40%), Cheyenne (54.1%, a difference of 0.42%), and Arapaho (54.1%, a difference of 0.47%).
| Demographics | Rating | Rank | College, 1 year or more |
| Shoshone | 0.2 /100 | #276 | Tragic 54.3% |
| Ecuadorians | 0.2 /100 | #277 | Tragic 54.3% |
| Immigrants | Jamaica | 0.1 /100 | #278 | Tragic 54.2% |
| Arapaho | 0.1 /100 | #279 | Tragic 54.1% |
| Cheyenne | 0.1 /100 | #280 | Tragic 54.1% |
| Colville | 0.1 /100 | #281 | Tragic 54.1% |
| Guyanese | 0.1 /100 | #282 | Tragic 54.1% |
| Nicaraguans | 0.1 /100 | #283 | Tragic 53.9% |
| Ute | 0.1 /100 | #284 | Tragic 53.8% |
| Immigrants | Guyana | 0.1 /100 | #285 | Tragic 53.5% |
| Central American Indians | 0.1 /100 | #286 | Tragic 53.5% |
| Immigrants | Belize | 0.1 /100 | #287 | Tragic 53.5% |
| Alaska Natives | 0.0 /100 | #288 | Tragic 53.4% |
| Immigrants | Ecuador | 0.0 /100 | #289 | Tragic 53.4% |
| Alaskan Athabascans | 0.0 /100 | #290 | Tragic 53.4% |