Immigrants from West Indies vs Hispanic or Latino College, 1 year or more
COMPARE
Immigrants from West Indies
Hispanic or Latino
College, 1 year or more
College, 1 year or more Comparison
Immigrants from West Indies
Hispanics or Latinos
55.2%
COLLEGE, 1 YEAR OR MORE
0.5/ 100
METRIC RATING
256th/ 347
METRIC RANK
51.1%
COLLEGE, 1 YEAR OR MORE
0.0/ 100
METRIC RATING
317th/ 347
METRIC RANK
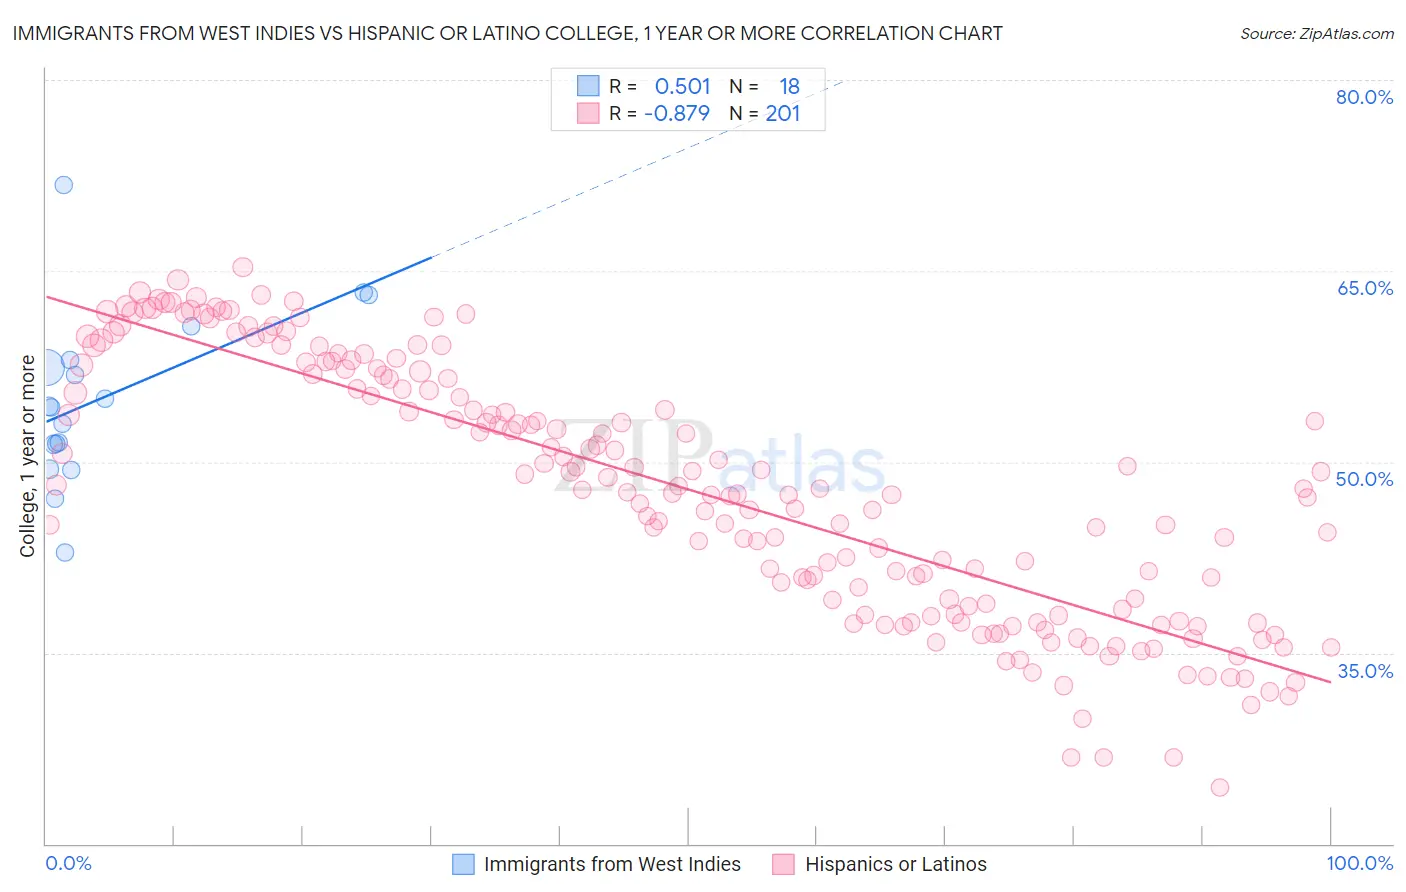
Immigrants from West Indies vs Hispanic or Latino College, 1 year or more Correlation Chart
The statistical analysis conducted on geographies consisting of 72,420,477 people shows a substantial positive correlation between the proportion of Immigrants from West Indies and percentage of population with at least college, 1 year or more education in the United States with a correlation coefficient (R) of 0.501 and weighted average of 55.2%. Similarly, the statistical analysis conducted on geographies consisting of 578,586,619 people shows a very strong negative correlation between the proportion of Hispanics or Latinos and percentage of population with at least college, 1 year or more education in the United States with a correlation coefficient (R) of -0.879 and weighted average of 51.1%, a difference of 7.9%.
College, 1 year or more Correlation Summary
| Measurement | Immigrants from West Indies | Hispanic or Latino |
| Minimum | 42.9% | 24.4% |
| Maximum | 71.8% | 65.3% |
| Range | 28.9% | 40.9% |
| Mean | 55.1% | 47.8% |
| Median | 54.3% | 47.8% |
| Interquartile 25% (IQ1) | 51.4% | 38.2% |
| Interquartile 75% (IQ3) | 58.0% | 57.0% |
| Interquartile Range (IQR) | 6.6% | 18.8% |
| Standard Deviation (Sample) | 6.8% | 10.0% |
| Standard Deviation (Population) | 6.6% | 10.0% |
Similar Demographics by College, 1 year or more
Demographics Similar to Immigrants from West Indies by College, 1 year or more
In terms of college, 1 year or more, the demographic groups most similar to Immigrants from West Indies are Immigrants from Bahamas (55.2%, a difference of 0.080%), Indonesian (55.1%, a difference of 0.10%), Japanese (55.2%, a difference of 0.12%), Immigrants from Barbados (55.4%, a difference of 0.38%), and African (55.0%, a difference of 0.38%).
| Demographics | Rating | Rank | College, 1 year or more |
| Immigrants | Trinidad and Tobago | 0.7 /100 | #249 | Tragic 55.5% |
| Delaware | 0.7 /100 | #250 | Tragic 55.5% |
| Immigrants | Cambodia | 0.6 /100 | #251 | Tragic 55.4% |
| Aleuts | 0.6 /100 | #252 | Tragic 55.4% |
| Immigrants | Barbados | 0.6 /100 | #253 | Tragic 55.4% |
| Japanese | 0.5 /100 | #254 | Tragic 55.2% |
| Immigrants | Bahamas | 0.5 /100 | #255 | Tragic 55.2% |
| Immigrants | West Indies | 0.5 /100 | #256 | Tragic 55.2% |
| Indonesians | 0.4 /100 | #257 | Tragic 55.1% |
| Africans | 0.4 /100 | #258 | Tragic 55.0% |
| Nepalese | 0.3 /100 | #259 | Tragic 54.9% |
| Jamaicans | 0.3 /100 | #260 | Tragic 54.9% |
| Ottawa | 0.3 /100 | #261 | Tragic 54.9% |
| Immigrants | St. Vincent and the Grenadines | 0.3 /100 | #262 | Tragic 54.8% |
| U.S. Virgin Islanders | 0.3 /100 | #263 | Tragic 54.8% |
Demographics Similar to Hispanics or Latinos by College, 1 year or more
In terms of college, 1 year or more, the demographic groups most similar to Hispanics or Latinos are Cajun (51.2%, a difference of 0.090%), Immigrants from Honduras (51.0%, a difference of 0.13%), Guatemalan (51.2%, a difference of 0.16%), Immigrants from El Salvador (51.0%, a difference of 0.22%), and Kiowa (51.0%, a difference of 0.28%).
| Demographics | Rating | Rank | College, 1 year or more |
| Hondurans | 0.0 /100 | #310 | Tragic 51.6% |
| Immigrants | Haiti | 0.0 /100 | #311 | Tragic 51.5% |
| Pueblo | 0.0 /100 | #312 | Tragic 51.5% |
| Immigrants | Caribbean | 0.0 /100 | #313 | Tragic 51.4% |
| Fijians | 0.0 /100 | #314 | Tragic 51.3% |
| Guatemalans | 0.0 /100 | #315 | Tragic 51.2% |
| Cajuns | 0.0 /100 | #316 | Tragic 51.2% |
| Hispanics or Latinos | 0.0 /100 | #317 | Tragic 51.1% |
| Immigrants | Honduras | 0.0 /100 | #318 | Tragic 51.0% |
| Immigrants | El Salvador | 0.0 /100 | #319 | Tragic 51.0% |
| Kiowa | 0.0 /100 | #320 | Tragic 51.0% |
| Hopi | 0.0 /100 | #321 | Tragic 50.9% |
| Navajo | 0.0 /100 | #322 | Tragic 50.8% |
| Immigrants | Guatemala | 0.0 /100 | #323 | Tragic 50.7% |
| Immigrants | Cuba | 0.0 /100 | #324 | Tragic 50.7% |