Osage vs Immigrants from Indonesia 9th Grade
COMPARE
Osage
Immigrants from Indonesia
9th Grade
9th Grade Comparison
Osage
Immigrants from Indonesia
95.5%
9TH GRADE
96.8/ 100
METRIC RATING
109th/ 347
METRIC RANK
94.5%
9TH GRADE
12.3/ 100
METRIC RATING
211th/ 347
METRIC RANK
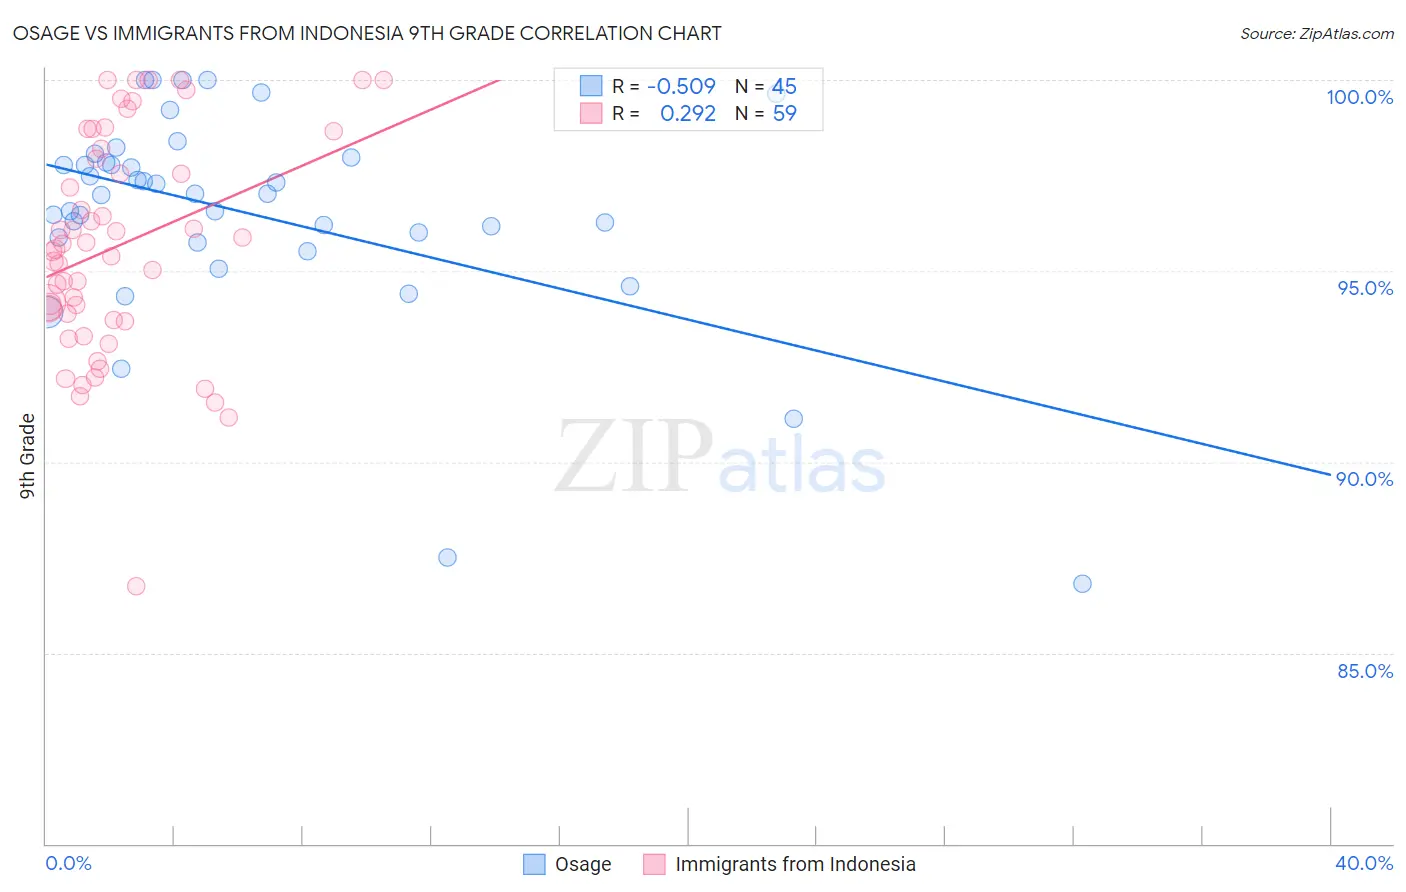
Osage vs Immigrants from Indonesia 9th Grade Correlation Chart
The statistical analysis conducted on geographies consisting of 91,808,929 people shows a substantial negative correlation between the proportion of Osage and percentage of population with at least 9th grade education in the United States with a correlation coefficient (R) of -0.509 and weighted average of 95.5%. Similarly, the statistical analysis conducted on geographies consisting of 215,671,959 people shows a weak positive correlation between the proportion of Immigrants from Indonesia and percentage of population with at least 9th grade education in the United States with a correlation coefficient (R) of 0.292 and weighted average of 94.5%, a difference of 0.99%.
9th Grade Correlation Summary
| Measurement | Osage | Immigrants from Indonesia |
| Minimum | 86.8% | 86.7% |
| Maximum | 100.0% | 100.0% |
| Range | 13.2% | 13.3% |
| Mean | 96.5% | 95.7% |
| Median | 97.0% | 95.6% |
| Interquartile 25% (IQ1) | 95.8% | 93.7% |
| Interquartile 75% (IQ3) | 97.9% | 98.2% |
| Interquartile Range (IQR) | 2.1% | 4.5% |
| Standard Deviation (Sample) | 2.8% | 2.9% |
| Standard Deviation (Population) | 2.8% | 2.9% |
Similar Demographics by 9th Grade
Demographics Similar to Osage by 9th Grade
In terms of 9th grade, the demographic groups most similar to Osage are Chickasaw (95.5%, a difference of 0.0%), Immigrants from Bulgaria (95.5%, a difference of 0.0%), Immigrants from Zimbabwe (95.5%, a difference of 0.010%), Immigrants from Norway (95.5%, a difference of 0.020%), and Cherokee (95.4%, a difference of 0.030%).
| Demographics | Rating | Rank | 9th Grade |
| Immigrants | Switzerland | 97.7 /100 | #102 | Exceptional 95.5% |
| Potawatomi | 97.7 /100 | #103 | Exceptional 95.5% |
| Syrians | 97.4 /100 | #104 | Exceptional 95.5% |
| Immigrants | France | 97.4 /100 | #105 | Exceptional 95.5% |
| Immigrants | Norway | 97.1 /100 | #106 | Exceptional 95.5% |
| Immigrants | Zimbabwe | 96.9 /100 | #107 | Exceptional 95.5% |
| Chickasaw | 96.8 /100 | #108 | Exceptional 95.5% |
| Osage | 96.8 /100 | #109 | Exceptional 95.5% |
| Immigrants | Bulgaria | 96.7 /100 | #110 | Exceptional 95.5% |
| Cherokee | 96.3 /100 | #111 | Exceptional 95.4% |
| Immigrants | Croatia | 96.2 /100 | #112 | Exceptional 95.4% |
| Iroquois | 96.2 /100 | #113 | Exceptional 95.4% |
| German Russians | 96.1 /100 | #114 | Exceptional 95.4% |
| Burmese | 96.0 /100 | #115 | Exceptional 95.4% |
| Immigrants | Europe | 95.7 /100 | #116 | Exceptional 95.4% |
Demographics Similar to Immigrants from Indonesia by 9th Grade
In terms of 9th grade, the demographic groups most similar to Immigrants from Indonesia are Immigrants from Malaysia (94.5%, a difference of 0.0%), Immigrants from Oceania (94.5%, a difference of 0.0%), Immigrants from Liberia (94.5%, a difference of 0.010%), Immigrants from Chile (94.5%, a difference of 0.020%), and Immigrants from Syria (94.5%, a difference of 0.020%).
| Demographics | Rating | Rank | 9th Grade |
| Moroccans | 19.6 /100 | #204 | Poor 94.6% |
| Immigrants | Sudan | 17.6 /100 | #205 | Poor 94.6% |
| Samoans | 17.3 /100 | #206 | Poor 94.6% |
| Immigrants | Morocco | 16.3 /100 | #207 | Poor 94.6% |
| Immigrants | Pakistan | 15.5 /100 | #208 | Poor 94.6% |
| Comanche | 14.9 /100 | #209 | Poor 94.6% |
| Immigrants | Chile | 13.4 /100 | #210 | Poor 94.5% |
| Immigrants | Indonesia | 12.3 /100 | #211 | Poor 94.5% |
| Immigrants | Malaysia | 12.2 /100 | #212 | Poor 94.5% |
| Immigrants | Oceania | 12.1 /100 | #213 | Poor 94.5% |
| Immigrants | Liberia | 11.8 /100 | #214 | Poor 94.5% |
| Immigrants | Syria | 11.0 /100 | #215 | Poor 94.5% |
| Immigrants | Western Asia | 10.7 /100 | #216 | Poor 94.5% |
| Asians | 9.9 /100 | #217 | Tragic 94.5% |
| Portuguese | 9.2 /100 | #218 | Tragic 94.5% |