Immigrants from Israel vs Croatian 9th Grade
COMPARE
Immigrants from Israel
Croatian
9th Grade
9th Grade Comparison
Immigrants from Israel
Croatians
95.3%
9TH GRADE
89.6/ 100
METRIC RATING
134th/ 347
METRIC RANK
96.5%
9TH GRADE
100.0/ 100
METRIC RATING
16th/ 347
METRIC RANK
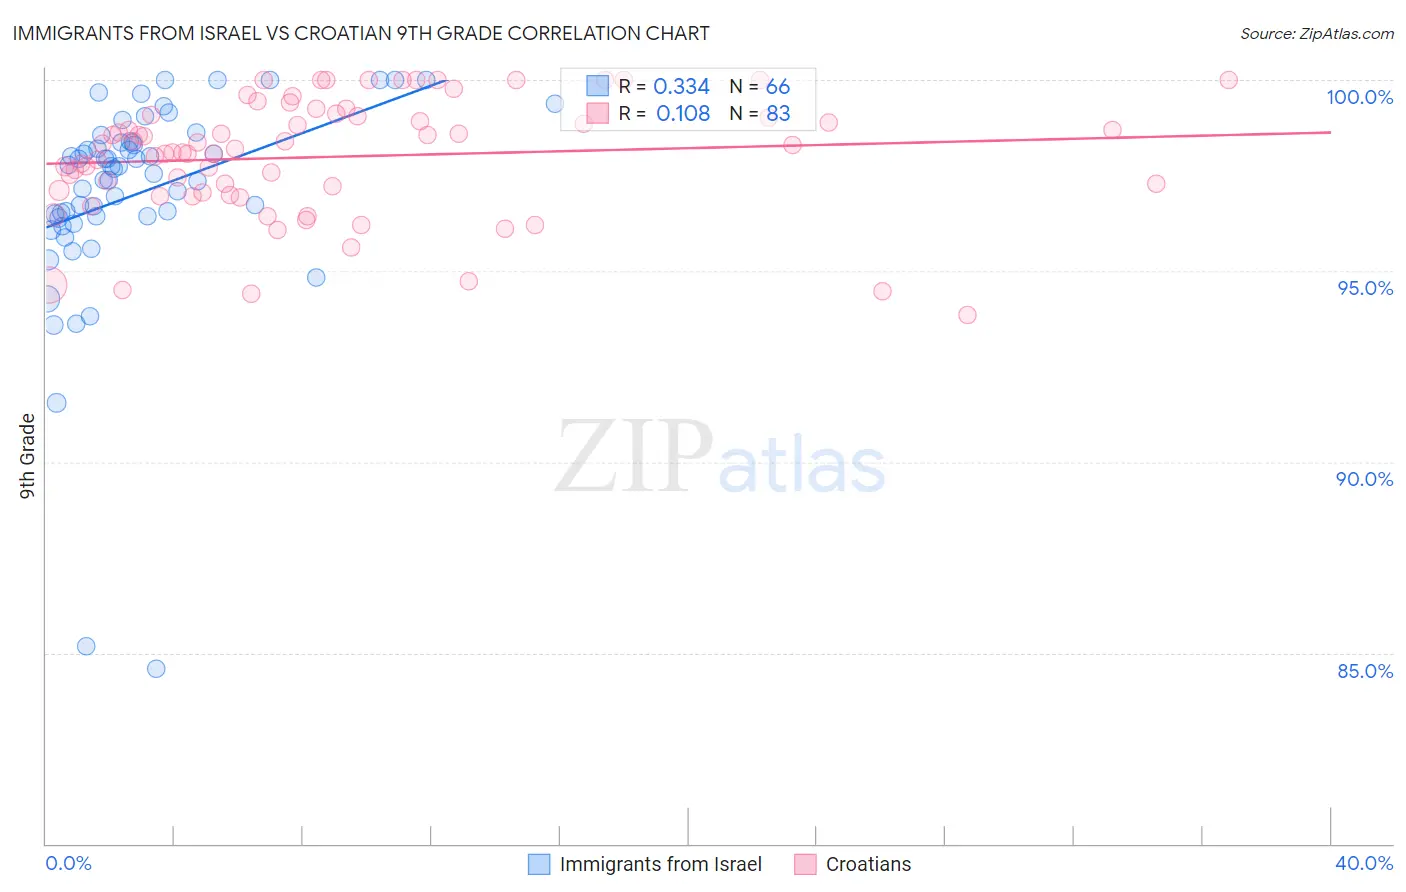
Immigrants from Israel vs Croatian 9th Grade Correlation Chart
The statistical analysis conducted on geographies consisting of 210,030,386 people shows a mild positive correlation between the proportion of Immigrants from Israel and percentage of population with at least 9th grade education in the United States with a correlation coefficient (R) of 0.334 and weighted average of 95.3%. Similarly, the statistical analysis conducted on geographies consisting of 375,734,264 people shows a poor positive correlation between the proportion of Croatians and percentage of population with at least 9th grade education in the United States with a correlation coefficient (R) of 0.108 and weighted average of 96.5%, a difference of 1.3%.
9th Grade Correlation Summary
| Measurement | Immigrants from Israel | Croatian |
| Minimum | 84.6% | 93.9% |
| Maximum | 100.0% | 100.0% |
| Range | 15.4% | 6.1% |
| Mean | 97.0% | 98.0% |
| Median | 97.7% | 98.2% |
| Interquartile 25% (IQ1) | 96.4% | 97.1% |
| Interquartile 75% (IQ3) | 98.4% | 99.1% |
| Interquartile Range (IQR) | 2.0% | 2.0% |
| Standard Deviation (Sample) | 2.8% | 1.5% |
| Standard Deviation (Population) | 2.8% | 1.5% |
Similar Demographics by 9th Grade
Demographics Similar to Immigrants from Israel by 9th Grade
In terms of 9th grade, the demographic groups most similar to Immigrants from Israel are Immigrants from Belarus (95.2%, a difference of 0.010%), Israeli (95.3%, a difference of 0.020%), Immigrants from Iran (95.2%, a difference of 0.020%), Hmong (95.2%, a difference of 0.040%), and Nonimmigrants (95.3%, a difference of 0.050%).
| Demographics | Rating | Rank | 9th Grade |
| Palestinians | 94.3 /100 | #127 | Exceptional 95.4% |
| Immigrants | Hungary | 94.2 /100 | #128 | Exceptional 95.4% |
| Basques | 94.1 /100 | #129 | Exceptional 95.4% |
| Jordanians | 93.5 /100 | #130 | Exceptional 95.3% |
| Immigrants | North Macedonia | 92.3 /100 | #131 | Exceptional 95.3% |
| Immigrants | Nonimmigrants | 92.0 /100 | #132 | Exceptional 95.3% |
| Israelis | 90.4 /100 | #133 | Exceptional 95.3% |
| Immigrants | Israel | 89.6 /100 | #134 | Excellent 95.3% |
| Immigrants | Belarus | 88.9 /100 | #135 | Excellent 95.2% |
| Immigrants | Iran | 88.3 /100 | #136 | Excellent 95.2% |
| Hmong | 87.7 /100 | #137 | Excellent 95.2% |
| Immigrants | Russia | 86.6 /100 | #138 | Excellent 95.2% |
| Immigrants | Eastern Europe | 85.8 /100 | #139 | Excellent 95.2% |
| Immigrants | Taiwan | 85.3 /100 | #140 | Excellent 95.2% |
| Immigrants | Bosnia and Herzegovina | 85.2 /100 | #141 | Excellent 95.2% |
Demographics Similar to Croatians by 9th Grade
In terms of 9th grade, the demographic groups most similar to Croatians are Scottish (96.5%, a difference of 0.0%), Irish (96.5%, a difference of 0.0%), Danish (96.5%, a difference of 0.010%), English (96.6%, a difference of 0.050%), and Dutch (96.5%, a difference of 0.060%).
| Demographics | Rating | Rank | 9th Grade |
| Tlingit-Haida | 100.0 /100 | #9 | Exceptional 96.6% |
| Lithuanians | 100.0 /100 | #10 | Exceptional 96.6% |
| Finns | 100.0 /100 | #11 | Exceptional 96.6% |
| English | 100.0 /100 | #12 | Exceptional 96.6% |
| Danes | 100.0 /100 | #13 | Exceptional 96.5% |
| Scottish | 100.0 /100 | #14 | Exceptional 96.5% |
| Irish | 100.0 /100 | #15 | Exceptional 96.5% |
| Croatians | 100.0 /100 | #16 | Exceptional 96.5% |
| Dutch | 100.0 /100 | #17 | Exceptional 96.5% |
| Scandinavians | 100.0 /100 | #18 | Exceptional 96.5% |
| Welsh | 100.0 /100 | #19 | Exceptional 96.4% |
| Italians | 100.0 /100 | #20 | Exceptional 96.4% |
| Alaskan Athabascans | 100.0 /100 | #21 | Exceptional 96.4% |
| Europeans | 100.0 /100 | #22 | Exceptional 96.4% |
| Czechs | 100.0 /100 | #23 | Exceptional 96.4% |