Osage vs Immigrants from South Africa 9th Grade
COMPARE
Osage
Immigrants from South Africa
9th Grade
9th Grade Comparison
Osage
Immigrants from South Africa
95.5%
9TH GRADE
96.8/ 100
METRIC RATING
109th/ 347
METRIC RANK
95.8%
9TH GRADE
99.4/ 100
METRIC RATING
78th/ 347
METRIC RANK
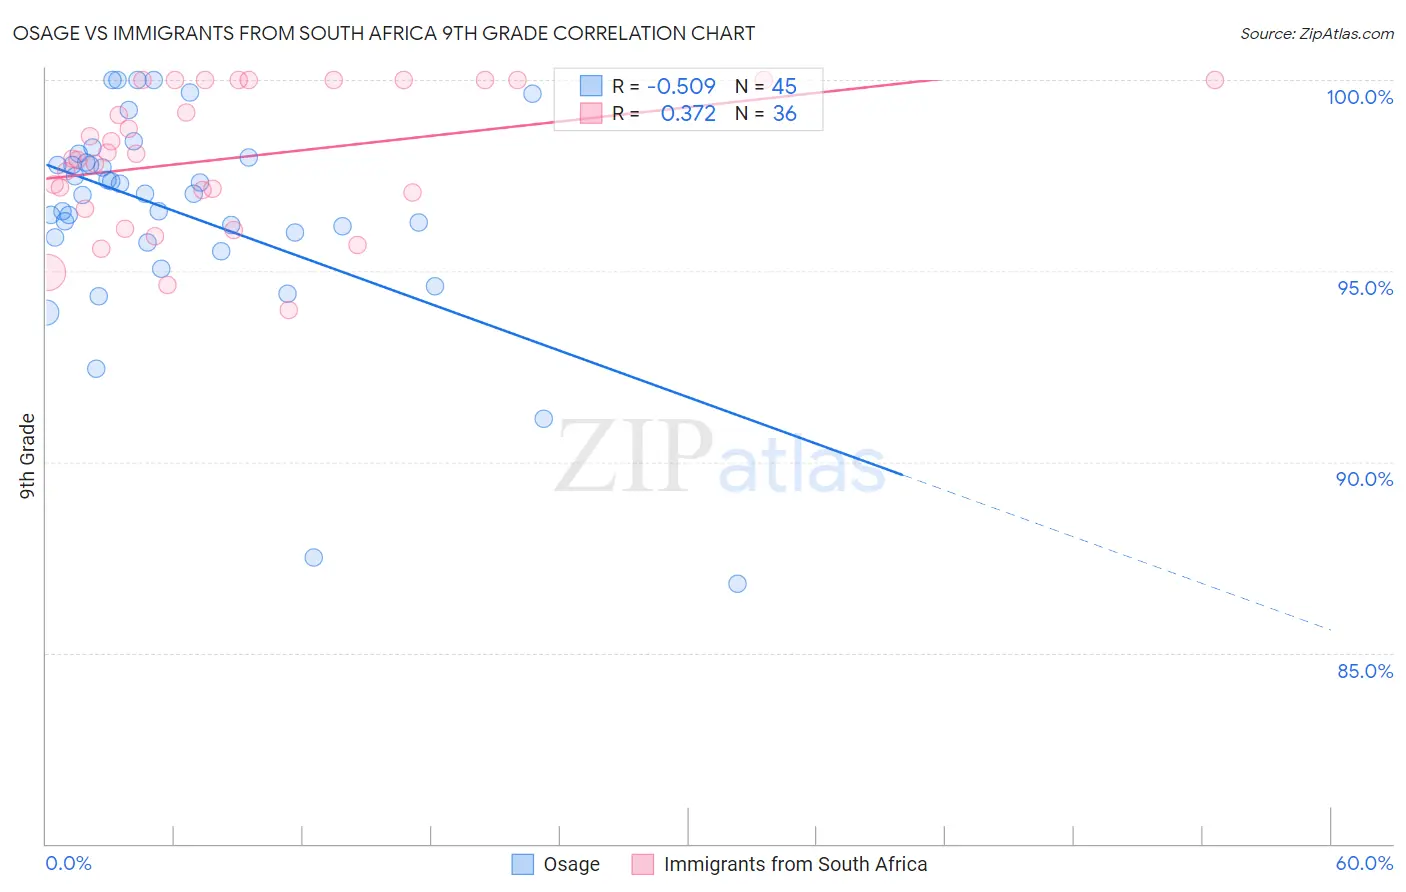
Osage vs Immigrants from South Africa 9th Grade Correlation Chart
The statistical analysis conducted on geographies consisting of 91,808,929 people shows a substantial negative correlation between the proportion of Osage and percentage of population with at least 9th grade education in the United States with a correlation coefficient (R) of -0.509 and weighted average of 95.5%. Similarly, the statistical analysis conducted on geographies consisting of 233,321,693 people shows a mild positive correlation between the proportion of Immigrants from South Africa and percentage of population with at least 9th grade education in the United States with a correlation coefficient (R) of 0.372 and weighted average of 95.8%, a difference of 0.32%.
9th Grade Correlation Summary
| Measurement | Osage | Immigrants from South Africa |
| Minimum | 86.8% | 94.0% |
| Maximum | 100.0% | 100.0% |
| Range | 13.2% | 6.0% |
| Mean | 96.5% | 98.0% |
| Median | 97.0% | 98.0% |
| Interquartile 25% (IQ1) | 95.8% | 96.8% |
| Interquartile 75% (IQ3) | 97.9% | 100.0% |
| Interquartile Range (IQR) | 2.1% | 3.2% |
| Standard Deviation (Sample) | 2.8% | 1.8% |
| Standard Deviation (Population) | 2.8% | 1.8% |
Similar Demographics by 9th Grade
Demographics Similar to Osage by 9th Grade
In terms of 9th grade, the demographic groups most similar to Osage are Chickasaw (95.5%, a difference of 0.0%), Immigrants from Bulgaria (95.5%, a difference of 0.0%), Immigrants from Zimbabwe (95.5%, a difference of 0.010%), Immigrants from Norway (95.5%, a difference of 0.020%), and Cherokee (95.4%, a difference of 0.030%).
| Demographics | Rating | Rank | 9th Grade |
| Immigrants | Switzerland | 97.7 /100 | #102 | Exceptional 95.5% |
| Potawatomi | 97.7 /100 | #103 | Exceptional 95.5% |
| Syrians | 97.4 /100 | #104 | Exceptional 95.5% |
| Immigrants | France | 97.4 /100 | #105 | Exceptional 95.5% |
| Immigrants | Norway | 97.1 /100 | #106 | Exceptional 95.5% |
| Immigrants | Zimbabwe | 96.9 /100 | #107 | Exceptional 95.5% |
| Chickasaw | 96.8 /100 | #108 | Exceptional 95.5% |
| Osage | 96.8 /100 | #109 | Exceptional 95.5% |
| Immigrants | Bulgaria | 96.7 /100 | #110 | Exceptional 95.5% |
| Cherokee | 96.3 /100 | #111 | Exceptional 95.4% |
| Immigrants | Croatia | 96.2 /100 | #112 | Exceptional 95.4% |
| Iroquois | 96.2 /100 | #113 | Exceptional 95.4% |
| German Russians | 96.1 /100 | #114 | Exceptional 95.4% |
| Burmese | 96.0 /100 | #115 | Exceptional 95.4% |
| Immigrants | Europe | 95.7 /100 | #116 | Exceptional 95.4% |
Demographics Similar to Immigrants from South Africa by 9th Grade
In terms of 9th grade, the demographic groups most similar to Immigrants from South Africa are White/Caucasian (95.8%, a difference of 0.0%), Inupiat (95.8%, a difference of 0.010%), Immigrants from Sweden (95.8%, a difference of 0.010%), Thai (95.8%, a difference of 0.020%), and Immigrants from Belgium (95.8%, a difference of 0.030%).
| Demographics | Rating | Rank | 9th Grade |
| Immigrants | Belgium | 99.5 /100 | #71 | Exceptional 95.8% |
| Turks | 99.5 /100 | #72 | Exceptional 95.8% |
| Immigrants | Singapore | 99.5 /100 | #73 | Exceptional 95.8% |
| Thais | 99.5 /100 | #74 | Exceptional 95.8% |
| Inupiat | 99.5 /100 | #75 | Exceptional 95.8% |
| Immigrants | Sweden | 99.5 /100 | #76 | Exceptional 95.8% |
| Whites/Caucasians | 99.4 /100 | #77 | Exceptional 95.8% |
| Immigrants | South Africa | 99.4 /100 | #78 | Exceptional 95.8% |
| Romanians | 99.3 /100 | #79 | Exceptional 95.7% |
| Bhutanese | 99.3 /100 | #80 | Exceptional 95.7% |
| Arapaho | 99.3 /100 | #81 | Exceptional 95.7% |
| Puget Sound Salish | 99.2 /100 | #82 | Exceptional 95.7% |
| Swiss | 99.2 /100 | #83 | Exceptional 95.7% |
| Immigrants | Denmark | 99.1 /100 | #84 | Exceptional 95.7% |
| Icelanders | 99.1 /100 | #85 | Exceptional 95.7% |