Ecuadorian vs Native/Alaskan College, Under 1 year
COMPARE
Ecuadorian
Native/Alaskan
College, Under 1 year
College, Under 1 year Comparison
Ecuadorians
Natives/Alaskans
59.3%
COLLEGE, UNDER 1 YEAR
0.0/ 100
METRIC RATING
290th/ 347
METRIC RANK
56.6%
COLLEGE, UNDER 1 YEAR
0.0/ 100
METRIC RATING
321st/ 347
METRIC RANK
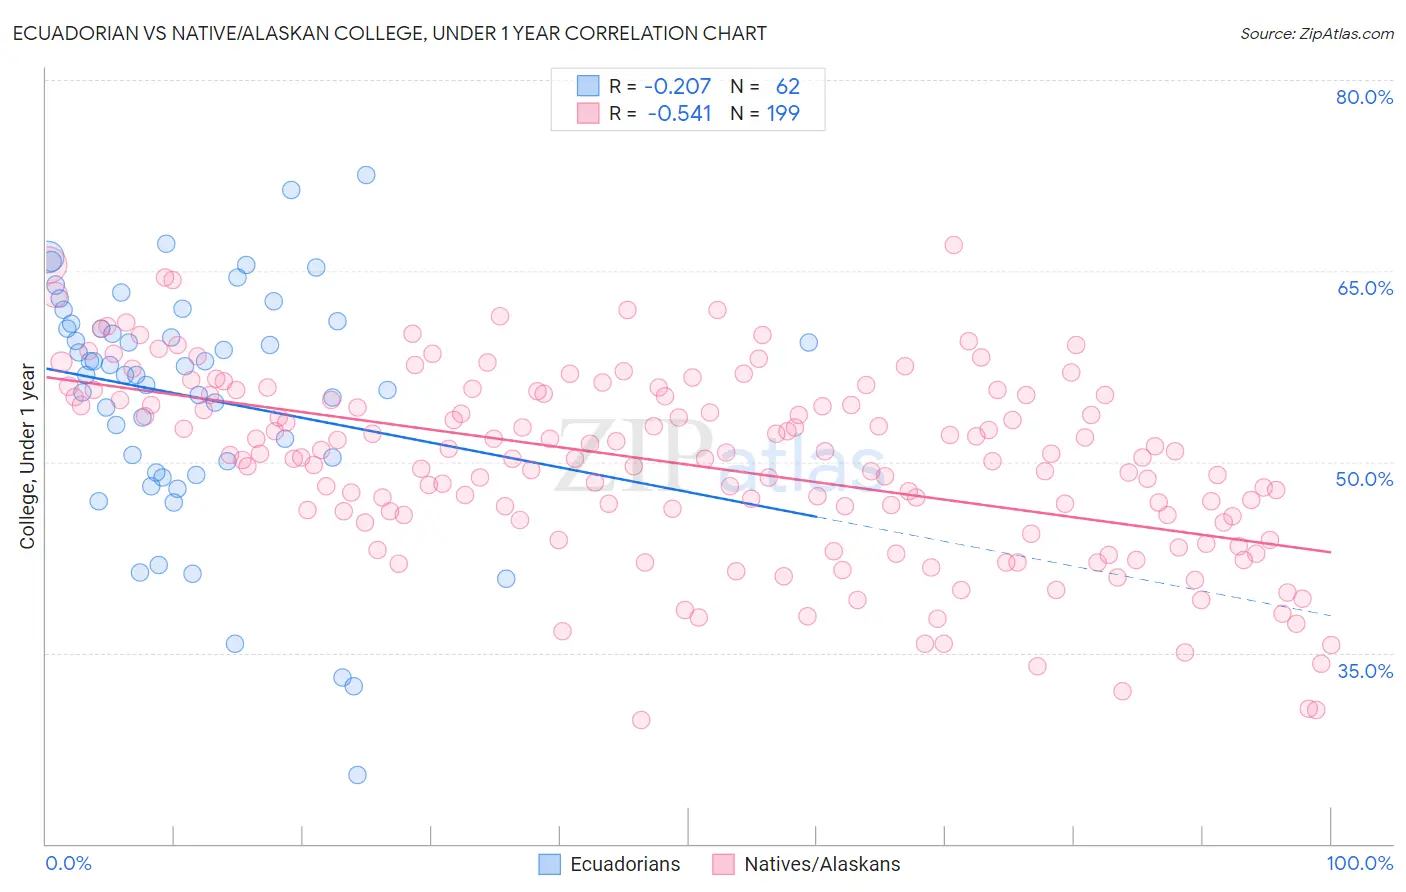
Ecuadorian vs Native/Alaskan College, Under 1 year Correlation Chart
The statistical analysis conducted on geographies consisting of 317,865,755 people shows a weak negative correlation between the proportion of Ecuadorians and percentage of population with at least college, under 1 year education in the United States with a correlation coefficient (R) of -0.207 and weighted average of 59.3%. Similarly, the statistical analysis conducted on geographies consisting of 513,071,269 people shows a substantial negative correlation between the proportion of Natives/Alaskans and percentage of population with at least college, under 1 year education in the United States with a correlation coefficient (R) of -0.541 and weighted average of 56.6%, a difference of 4.7%.
College, Under 1 year Correlation Summary
| Measurement | Ecuadorian | Native/Alaskan |
| Minimum | 25.4% | 29.7% |
| Maximum | 72.5% | 67.0% |
| Range | 47.2% | 37.4% |
| Mean | 55.1% | 49.8% |
| Median | 57.2% | 50.4% |
| Interquartile 25% (IQ1) | 50.1% | 45.4% |
| Interquartile 75% (IQ3) | 60.9% | 55.2% |
| Interquartile Range (IQR) | 10.8% | 9.8% |
| Standard Deviation (Sample) | 9.4% | 7.4% |
| Standard Deviation (Population) | 9.3% | 7.4% |
Similar Demographics by College, Under 1 year
Demographics Similar to Ecuadorians by College, Under 1 year
In terms of college, under 1 year, the demographic groups most similar to Ecuadorians are Choctaw (59.3%, a difference of 0.040%), Creek (59.3%, a difference of 0.090%), Black/African American (59.4%, a difference of 0.11%), Nicaraguan (59.2%, a difference of 0.13%), and Sioux (59.4%, a difference of 0.21%).
| Demographics | Rating | Rank | College, Under 1 year |
| Immigrants | Jamaica | 0.0 /100 | #283 | Tragic 59.7% |
| Immigrants | St. Vincent and the Grenadines | 0.0 /100 | #284 | Tragic 59.6% |
| Paiute | 0.0 /100 | #285 | Tragic 59.6% |
| British West Indians | 0.0 /100 | #286 | Tragic 59.5% |
| Sioux | 0.0 /100 | #287 | Tragic 59.4% |
| Blacks/African Americans | 0.0 /100 | #288 | Tragic 59.4% |
| Choctaw | 0.0 /100 | #289 | Tragic 59.3% |
| Ecuadorians | 0.0 /100 | #290 | Tragic 59.3% |
| Creek | 0.0 /100 | #291 | Tragic 59.3% |
| Nicaraguans | 0.0 /100 | #292 | Tragic 59.2% |
| Seminole | 0.0 /100 | #293 | Tragic 59.1% |
| Immigrants | Belize | 0.0 /100 | #294 | Tragic 59.1% |
| Immigrants | Grenada | 0.0 /100 | #295 | Tragic 59.1% |
| Central American Indians | 0.0 /100 | #296 | Tragic 59.0% |
| Guyanese | 0.0 /100 | #297 | Tragic 59.0% |
Demographics Similar to Natives/Alaskans by College, Under 1 year
In terms of college, under 1 year, the demographic groups most similar to Natives/Alaskans are Immigrants from Caribbean (56.6%, a difference of 0.13%), Guatemalan (56.8%, a difference of 0.26%), Immigrants from Honduras (56.5%, a difference of 0.31%), Puerto Rican (56.8%, a difference of 0.32%), and Immigrants from El Salvador (56.4%, a difference of 0.44%).
| Demographics | Rating | Rank | College, Under 1 year |
| Hopi | 0.0 /100 | #314 | Tragic 57.1% |
| Hondurans | 0.0 /100 | #315 | Tragic 57.1% |
| Menominee | 0.0 /100 | #316 | Tragic 57.0% |
| Hispanics or Latinos | 0.0 /100 | #317 | Tragic 57.0% |
| Immigrants | Haiti | 0.0 /100 | #318 | Tragic 56.9% |
| Puerto Ricans | 0.0 /100 | #319 | Tragic 56.8% |
| Guatemalans | 0.0 /100 | #320 | Tragic 56.8% |
| Natives/Alaskans | 0.0 /100 | #321 | Tragic 56.6% |
| Immigrants | Caribbean | 0.0 /100 | #322 | Tragic 56.6% |
| Immigrants | Honduras | 0.0 /100 | #323 | Tragic 56.5% |
| Immigrants | El Salvador | 0.0 /100 | #324 | Tragic 56.4% |
| Immigrants | Latin America | 0.0 /100 | #325 | Tragic 56.3% |
| Navajo | 0.0 /100 | #326 | Tragic 56.3% |
| Immigrants | Guatemala | 0.0 /100 | #327 | Tragic 56.2% |
| Cape Verdeans | 0.0 /100 | #328 | Tragic 56.0% |