Immigrants from Eastern Europe vs Native/Alaskan College, Under 1 year
COMPARE
Immigrants from Eastern Europe
Native/Alaskan
College, Under 1 year
College, Under 1 year Comparison
Immigrants from Eastern Europe
Natives/Alaskans
67.9%
COLLEGE, UNDER 1 YEAR
96.9/ 100
METRIC RATING
101st/ 347
METRIC RANK
56.6%
COLLEGE, UNDER 1 YEAR
0.0/ 100
METRIC RATING
321st/ 347
METRIC RANK
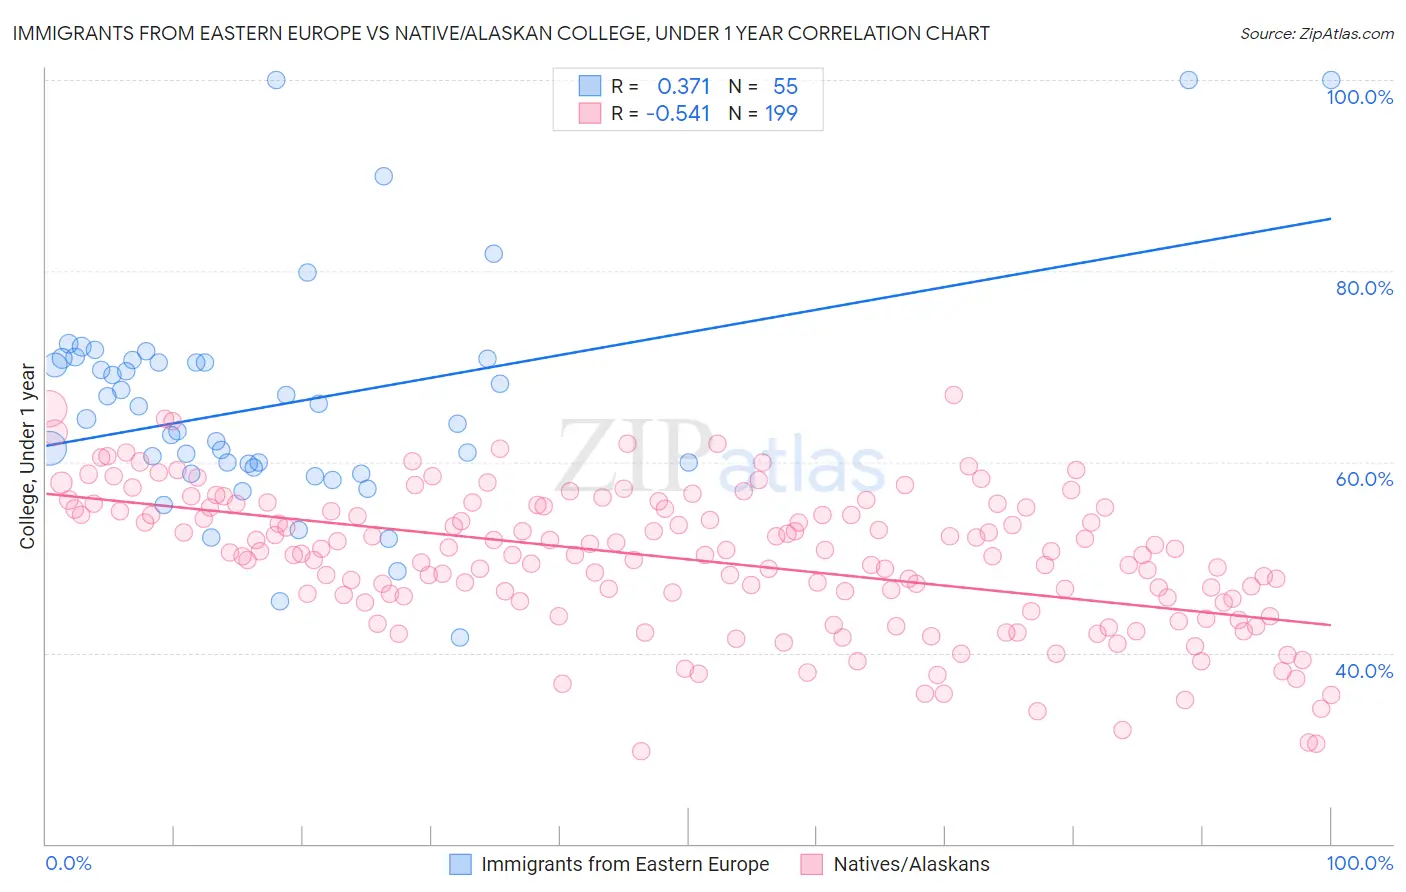
Immigrants from Eastern Europe vs Native/Alaskan College, Under 1 year Correlation Chart
The statistical analysis conducted on geographies consisting of 475,875,489 people shows a mild positive correlation between the proportion of Immigrants from Eastern Europe and percentage of population with at least college, under 1 year education in the United States with a correlation coefficient (R) of 0.371 and weighted average of 67.9%. Similarly, the statistical analysis conducted on geographies consisting of 513,071,269 people shows a substantial negative correlation between the proportion of Natives/Alaskans and percentage of population with at least college, under 1 year education in the United States with a correlation coefficient (R) of -0.541 and weighted average of 56.6%, a difference of 19.8%.
College, Under 1 year Correlation Summary
| Measurement | Immigrants from Eastern Europe | Native/Alaskan |
| Minimum | 41.6% | 29.7% |
| Maximum | 100.0% | 67.0% |
| Range | 58.4% | 37.4% |
| Mean | 66.0% | 49.8% |
| Median | 64.5% | 50.4% |
| Interquartile 25% (IQ1) | 59.4% | 45.4% |
| Interquartile 75% (IQ3) | 70.7% | 55.2% |
| Interquartile Range (IQR) | 11.3% | 9.8% |
| Standard Deviation (Sample) | 11.8% | 7.4% |
| Standard Deviation (Population) | 11.7% | 7.4% |
Similar Demographics by College, Under 1 year
Demographics Similar to Immigrants from Eastern Europe by College, Under 1 year
In terms of college, under 1 year, the demographic groups most similar to Immigrants from Eastern Europe are Palestinian (67.9%, a difference of 0.0%), Carpatho Rusyn (67.9%, a difference of 0.010%), Immigrants from Argentina (67.9%, a difference of 0.050%), Immigrants from Bolivia (67.9%, a difference of 0.060%), and Paraguayan (67.9%, a difference of 0.080%).
| Demographics | Rating | Rank | College, Under 1 year |
| Armenians | 97.7 /100 | #94 | Exceptional 68.1% |
| Immigrants | Pakistan | 97.5 /100 | #95 | Exceptional 68.0% |
| Jordanians | 97.4 /100 | #96 | Exceptional 68.0% |
| Immigrants | Ethiopia | 97.3 /100 | #97 | Exceptional 68.0% |
| Paraguayans | 97.1 /100 | #98 | Exceptional 67.9% |
| Immigrants | Bolivia | 97.0 /100 | #99 | Exceptional 67.9% |
| Immigrants | Argentina | 97.0 /100 | #100 | Exceptional 67.9% |
| Immigrants | Eastern Europe | 96.9 /100 | #101 | Exceptional 67.9% |
| Palestinians | 96.9 /100 | #102 | Exceptional 67.9% |
| Carpatho Rusyns | 96.8 /100 | #103 | Exceptional 67.9% |
| Immigrants | Western Asia | 96.6 /100 | #104 | Exceptional 67.8% |
| Afghans | 96.6 /100 | #105 | Exceptional 67.8% |
| Immigrants | Croatia | 96.6 /100 | #106 | Exceptional 67.8% |
| Austrians | 96.4 /100 | #107 | Exceptional 67.8% |
| Immigrants | Egypt | 96.0 /100 | #108 | Exceptional 67.7% |
Demographics Similar to Natives/Alaskans by College, Under 1 year
In terms of college, under 1 year, the demographic groups most similar to Natives/Alaskans are Immigrants from Caribbean (56.6%, a difference of 0.13%), Guatemalan (56.8%, a difference of 0.26%), Immigrants from Honduras (56.5%, a difference of 0.31%), Puerto Rican (56.8%, a difference of 0.32%), and Immigrants from El Salvador (56.4%, a difference of 0.44%).
| Demographics | Rating | Rank | College, Under 1 year |
| Hopi | 0.0 /100 | #314 | Tragic 57.1% |
| Hondurans | 0.0 /100 | #315 | Tragic 57.1% |
| Menominee | 0.0 /100 | #316 | Tragic 57.0% |
| Hispanics or Latinos | 0.0 /100 | #317 | Tragic 57.0% |
| Immigrants | Haiti | 0.0 /100 | #318 | Tragic 56.9% |
| Puerto Ricans | 0.0 /100 | #319 | Tragic 56.8% |
| Guatemalans | 0.0 /100 | #320 | Tragic 56.8% |
| Natives/Alaskans | 0.0 /100 | #321 | Tragic 56.6% |
| Immigrants | Caribbean | 0.0 /100 | #322 | Tragic 56.6% |
| Immigrants | Honduras | 0.0 /100 | #323 | Tragic 56.5% |
| Immigrants | El Salvador | 0.0 /100 | #324 | Tragic 56.4% |
| Immigrants | Latin America | 0.0 /100 | #325 | Tragic 56.3% |
| Navajo | 0.0 /100 | #326 | Tragic 56.3% |
| Immigrants | Guatemala | 0.0 /100 | #327 | Tragic 56.2% |
| Cape Verdeans | 0.0 /100 | #328 | Tragic 56.0% |