Moroccan vs Native/Alaskan College, Under 1 year
COMPARE
Moroccan
Native/Alaskan
College, Under 1 year
College, Under 1 year Comparison
Moroccans
Natives/Alaskans
65.6%
COLLEGE, UNDER 1 YEAR
56.7/ 100
METRIC RATING
166th/ 347
METRIC RANK
56.6%
COLLEGE, UNDER 1 YEAR
0.0/ 100
METRIC RATING
321st/ 347
METRIC RANK
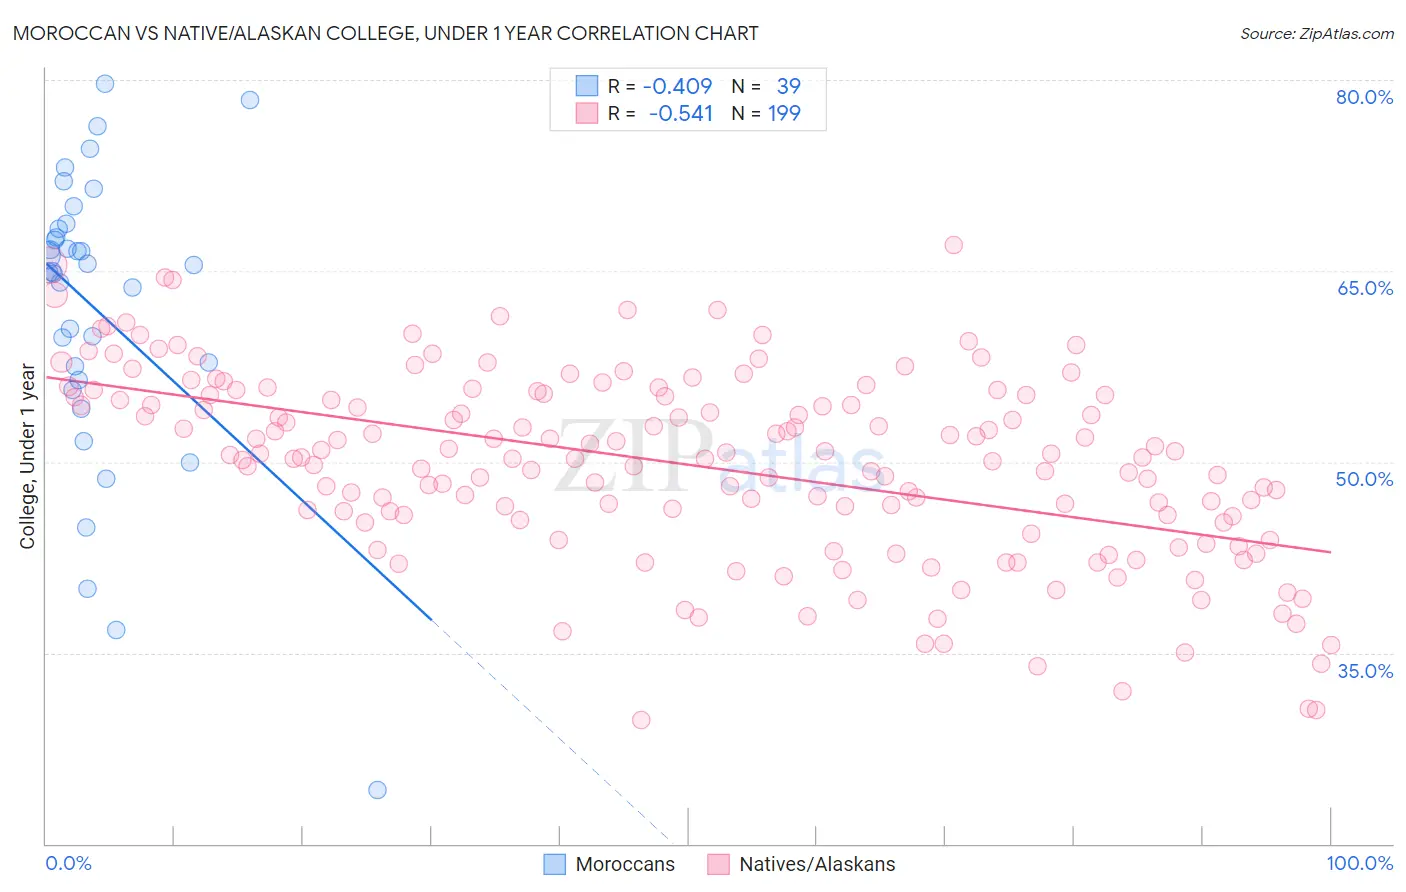
Moroccan vs Native/Alaskan College, Under 1 year Correlation Chart
The statistical analysis conducted on geographies consisting of 201,817,667 people shows a moderate negative correlation between the proportion of Moroccans and percentage of population with at least college, under 1 year education in the United States with a correlation coefficient (R) of -0.409 and weighted average of 65.6%. Similarly, the statistical analysis conducted on geographies consisting of 513,071,269 people shows a substantial negative correlation between the proportion of Natives/Alaskans and percentage of population with at least college, under 1 year education in the United States with a correlation coefficient (R) of -0.541 and weighted average of 56.6%, a difference of 15.8%.
College, Under 1 year Correlation Summary
| Measurement | Moroccan | Native/Alaskan |
| Minimum | 24.2% | 29.7% |
| Maximum | 79.7% | 67.0% |
| Range | 55.5% | 37.4% |
| Mean | 61.8% | 49.8% |
| Median | 64.9% | 50.4% |
| Interquartile 25% (IQ1) | 56.5% | 45.4% |
| Interquartile 75% (IQ3) | 68.4% | 55.2% |
| Interquartile Range (IQR) | 11.9% | 9.8% |
| Standard Deviation (Sample) | 11.6% | 7.4% |
| Standard Deviation (Population) | 11.4% | 7.4% |
Similar Demographics by College, Under 1 year
Demographics Similar to Moroccans by College, Under 1 year
In terms of college, under 1 year, the demographic groups most similar to Moroccans are Immigrants from Somalia (65.6%, a difference of 0.010%), Hungarian (65.6%, a difference of 0.030%), Yugoslavian (65.6%, a difference of 0.040%), German (65.6%, a difference of 0.040%), and Immigrants from Oceania (65.6%, a difference of 0.080%).
| Demographics | Rating | Rank | College, Under 1 year |
| Tlingit-Haida | 66.4 /100 | #159 | Good 65.9% |
| Albanians | 66.1 /100 | #160 | Good 65.9% |
| Brazilians | 66.0 /100 | #161 | Good 65.9% |
| Koreans | 65.3 /100 | #162 | Good 65.9% |
| Somalis | 62.7 /100 | #163 | Good 65.8% |
| Czechoslovakians | 62.6 /100 | #164 | Good 65.8% |
| Immigrants | Uzbekistan | 61.6 /100 | #165 | Good 65.8% |
| Moroccans | 56.7 /100 | #166 | Average 65.6% |
| Immigrants | Somalia | 56.4 /100 | #167 | Average 65.6% |
| Hungarians | 55.9 /100 | #168 | Average 65.6% |
| Yugoslavians | 55.7 /100 | #169 | Average 65.6% |
| Germans | 55.7 /100 | #170 | Average 65.6% |
| Immigrants | Oceania | 55.0 /100 | #171 | Average 65.6% |
| South American Indians | 54.4 /100 | #172 | Average 65.5% |
| Swiss | 53.9 /100 | #173 | Average 65.5% |
Demographics Similar to Natives/Alaskans by College, Under 1 year
In terms of college, under 1 year, the demographic groups most similar to Natives/Alaskans are Immigrants from Caribbean (56.6%, a difference of 0.13%), Guatemalan (56.8%, a difference of 0.26%), Immigrants from Honduras (56.5%, a difference of 0.31%), Puerto Rican (56.8%, a difference of 0.32%), and Immigrants from El Salvador (56.4%, a difference of 0.44%).
| Demographics | Rating | Rank | College, Under 1 year |
| Hopi | 0.0 /100 | #314 | Tragic 57.1% |
| Hondurans | 0.0 /100 | #315 | Tragic 57.1% |
| Menominee | 0.0 /100 | #316 | Tragic 57.0% |
| Hispanics or Latinos | 0.0 /100 | #317 | Tragic 57.0% |
| Immigrants | Haiti | 0.0 /100 | #318 | Tragic 56.9% |
| Puerto Ricans | 0.0 /100 | #319 | Tragic 56.8% |
| Guatemalans | 0.0 /100 | #320 | Tragic 56.8% |
| Natives/Alaskans | 0.0 /100 | #321 | Tragic 56.6% |
| Immigrants | Caribbean | 0.0 /100 | #322 | Tragic 56.6% |
| Immigrants | Honduras | 0.0 /100 | #323 | Tragic 56.5% |
| Immigrants | El Salvador | 0.0 /100 | #324 | Tragic 56.4% |
| Immigrants | Latin America | 0.0 /100 | #325 | Tragic 56.3% |
| Navajo | 0.0 /100 | #326 | Tragic 56.3% |
| Immigrants | Guatemala | 0.0 /100 | #327 | Tragic 56.2% |
| Cape Verdeans | 0.0 /100 | #328 | Tragic 56.0% |