Okinawan vs Immigrants from Asia 11th Grade
COMPARE
Okinawan
Immigrants from Asia
11th Grade
11th Grade Comparison
Okinawans
Immigrants from Asia
94.0%
11TH GRADE
99.8/ 100
METRIC RATING
60th/ 347
METRIC RANK
92.4%
11TH GRADE
37.4/ 100
METRIC RATING
184th/ 347
METRIC RANK
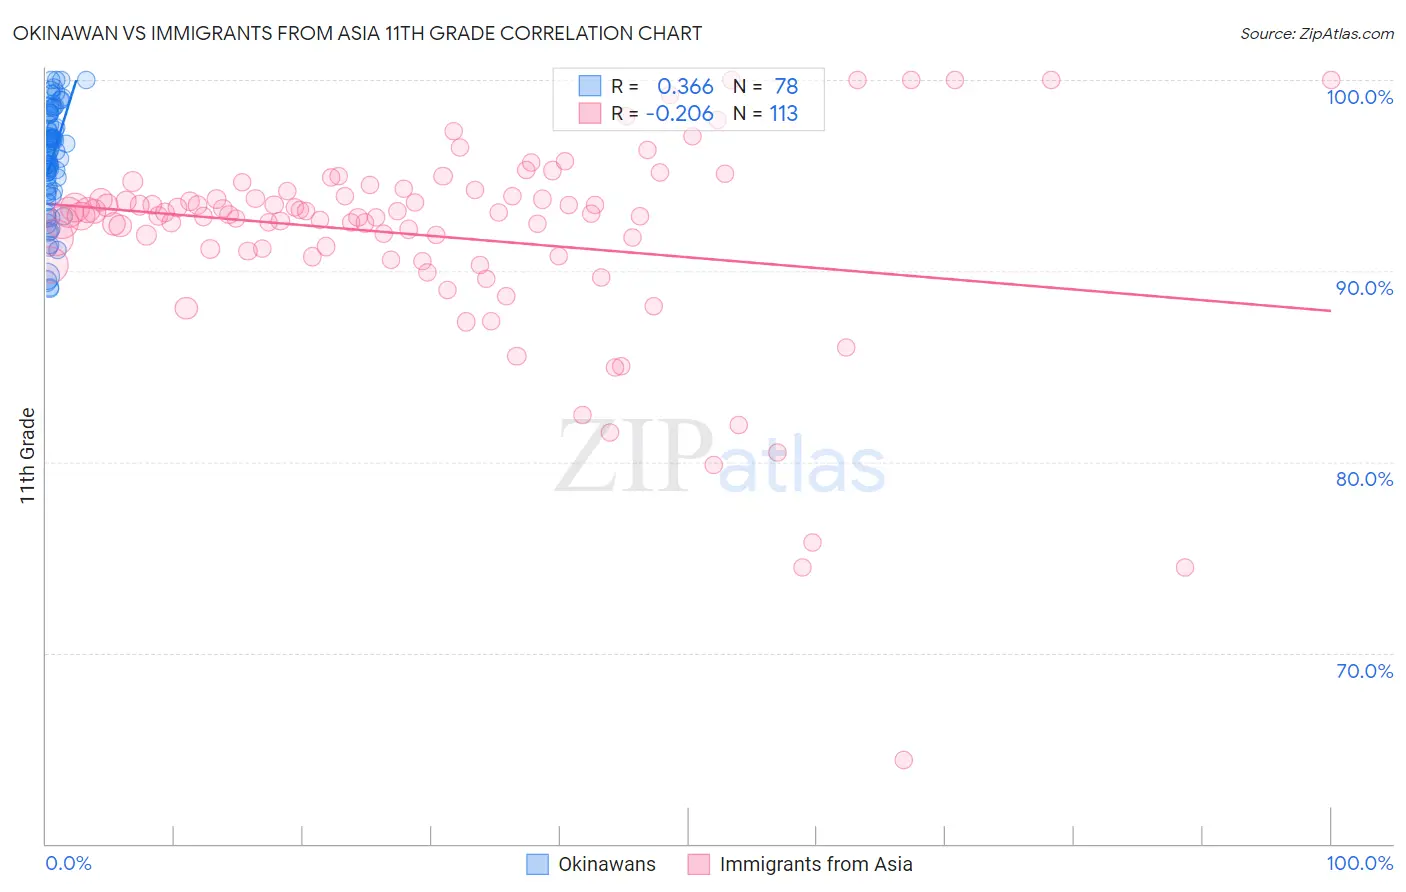
Okinawan vs Immigrants from Asia 11th Grade Correlation Chart
The statistical analysis conducted on geographies consisting of 73,775,797 people shows a mild positive correlation between the proportion of Okinawans and percentage of population with at least 11th grade education in the United States with a correlation coefficient (R) of 0.366 and weighted average of 94.0%. Similarly, the statistical analysis conducted on geographies consisting of 549,170,438 people shows a weak negative correlation between the proportion of Immigrants from Asia and percentage of population with at least 11th grade education in the United States with a correlation coefficient (R) of -0.206 and weighted average of 92.4%, a difference of 1.7%.
11th Grade Correlation Summary
| Measurement | Okinawan | Immigrants from Asia |
| Minimum | 89.1% | 64.4% |
| Maximum | 100.0% | 100.0% |
| Range | 10.9% | 35.6% |
| Mean | 95.9% | 91.8% |
| Median | 96.2% | 93.0% |
| Interquartile 25% (IQ1) | 94.1% | 90.9% |
| Interquartile 75% (IQ3) | 98.1% | 94.1% |
| Interquartile Range (IQR) | 4.0% | 3.1% |
| Standard Deviation (Sample) | 2.8% | 5.4% |
| Standard Deviation (Population) | 2.7% | 5.4% |
Similar Demographics by 11th Grade
Demographics Similar to Okinawans by 11th Grade
In terms of 11th grade, the demographic groups most similar to Okinawans are French Canadian (94.0%, a difference of 0.0%), New Zealander (94.0%, a difference of 0.0%), Iranian (94.0%, a difference of 0.0%), Bhutanese (94.0%, a difference of 0.0%), and Immigrants from North America (94.0%, a difference of 0.010%).
| Demographics | Rating | Rank | 11th Grade |
| Immigrants | Australia | 99.9 /100 | #53 | Exceptional 94.0% |
| Immigrants | North America | 99.9 /100 | #54 | Exceptional 94.0% |
| Czechoslovakians | 99.9 /100 | #55 | Exceptional 94.0% |
| French Canadians | 99.9 /100 | #56 | Exceptional 94.0% |
| New Zealanders | 99.9 /100 | #57 | Exceptional 94.0% |
| Iranians | 99.9 /100 | #58 | Exceptional 94.0% |
| Bhutanese | 99.8 /100 | #59 | Exceptional 94.0% |
| Okinawans | 99.8 /100 | #60 | Exceptional 94.0% |
| Immigrants | Belgium | 99.8 /100 | #61 | Exceptional 94.0% |
| Austrians | 99.8 /100 | #62 | Exceptional 94.0% |
| Ukrainians | 99.8 /100 | #63 | Exceptional 94.0% |
| Immigrants | Sweden | 99.8 /100 | #64 | Exceptional 93.9% |
| Native Hawaiians | 99.8 /100 | #65 | Exceptional 93.9% |
| Alaskan Athabascans | 99.8 /100 | #66 | Exceptional 93.9% |
| Immigrants | Netherlands | 99.8 /100 | #67 | Exceptional 93.9% |
Demographics Similar to Immigrants from Asia by 11th Grade
In terms of 11th grade, the demographic groups most similar to Immigrants from Asia are Immigrants from Malaysia (92.4%, a difference of 0.0%), Immigrants from Morocco (92.4%, a difference of 0.010%), Immigrants from Nepal (92.4%, a difference of 0.010%), Arapaho (92.4%, a difference of 0.020%), and Inupiat (92.4%, a difference of 0.030%).
| Demographics | Rating | Rank | 11th Grade |
| Guamanians/Chamorros | 45.0 /100 | #177 | Average 92.5% |
| Sudanese | 43.4 /100 | #178 | Average 92.5% |
| Creek | 40.9 /100 | #179 | Average 92.4% |
| Inupiat | 40.7 /100 | #180 | Average 92.4% |
| Cherokee | 40.7 /100 | #181 | Average 92.4% |
| Immigrants | Morocco | 38.6 /100 | #182 | Fair 92.4% |
| Immigrants | Malaysia | 37.6 /100 | #183 | Fair 92.4% |
| Immigrants | Asia | 37.4 /100 | #184 | Fair 92.4% |
| Immigrants | Nepal | 36.4 /100 | #185 | Fair 92.4% |
| Arapaho | 35.1 /100 | #186 | Fair 92.4% |
| Immigrants | Western Asia | 35.0 /100 | #187 | Fair 92.4% |
| Immigrants | Indonesia | 33.7 /100 | #188 | Fair 92.4% |
| Immigrants | Chile | 33.3 /100 | #189 | Fair 92.4% |
| Chickasaw | 31.4 /100 | #190 | Fair 92.3% |
| French American Indians | 30.8 /100 | #191 | Fair 92.3% |