Laotian vs Alaska Native No Schooling Completed
COMPARE
Laotian
Alaska Native
No Schooling Completed
No Schooling Completed Comparison
Laotians
Alaska Natives
2.2%
NO SCHOOLING COMPLETED
13.3/ 100
METRIC RATING
203rd/ 347
METRIC RANK
1.5%
NO SCHOOLING COMPLETED
100.0/ 100
METRIC RATING
22nd/ 347
METRIC RANK
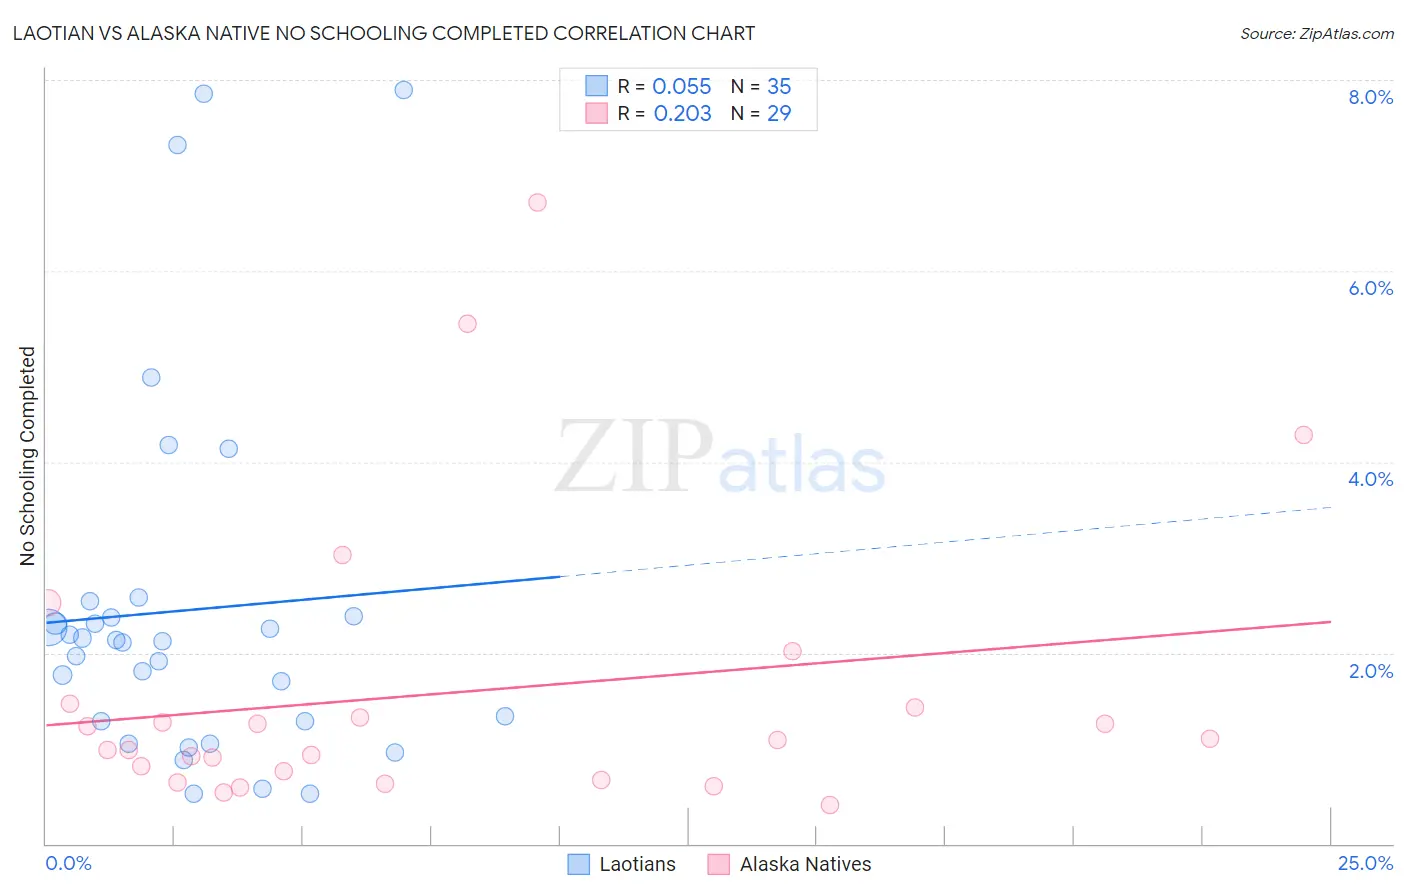
Laotian vs Alaska Native No Schooling Completed Correlation Chart
The statistical analysis conducted on geographies consisting of 223,538,268 people shows a slight positive correlation between the proportion of Laotians and percentage of population with no schooling in the United States with a correlation coefficient (R) of 0.055 and weighted average of 2.2%. Similarly, the statistical analysis conducted on geographies consisting of 76,332,603 people shows a weak positive correlation between the proportion of Alaska Natives and percentage of population with no schooling in the United States with a correlation coefficient (R) of 0.203 and weighted average of 1.5%, a difference of 50.8%.
No Schooling Completed Correlation Summary
| Measurement | Laotian | Alaska Native |
| Minimum | 0.52% | 0.40% |
| Maximum | 7.9% | 6.7% |
| Range | 7.4% | 6.3% |
| Mean | 2.4% | 1.6% |
| Median | 2.1% | 1.1% |
| Interquartile 25% (IQ1) | 1.3% | 0.71% |
| Interquartile 75% (IQ3) | 2.4% | 1.4% |
| Interquartile Range (IQR) | 1.1% | 0.74% |
| Standard Deviation (Sample) | 1.9% | 1.5% |
| Standard Deviation (Population) | 1.9% | 1.5% |
Similar Demographics by No Schooling Completed
Demographics Similar to Laotians by No Schooling Completed
In terms of no schooling completed, the demographic groups most similar to Laotians are Moroccan (2.2%, a difference of 0.11%), Hopi (2.2%, a difference of 0.11%), Immigrants from Bahamas (2.2%, a difference of 0.51%), Bahamian (2.2%, a difference of 0.51%), and South American Indian (2.2%, a difference of 0.70%).
| Demographics | Rating | Rank | No Schooling Completed |
| Immigrants | Ukraine | 26.1 /100 | #196 | Fair 2.2% |
| Immigrants | Southern Europe | 23.8 /100 | #197 | Fair 2.2% |
| Immigrants | Chile | 22.7 /100 | #198 | Fair 2.2% |
| Africans | 21.8 /100 | #199 | Fair 2.2% |
| Immigrants | Northern Africa | 19.5 /100 | #200 | Poor 2.2% |
| Costa Ricans | 17.1 /100 | #201 | Poor 2.2% |
| Moroccans | 13.7 /100 | #202 | Poor 2.2% |
| Laotians | 13.3 /100 | #203 | Poor 2.2% |
| Hopi | 12.9 /100 | #204 | Poor 2.2% |
| Immigrants | Bahamas | 11.6 /100 | #205 | Poor 2.2% |
| Bahamians | 11.6 /100 | #206 | Poor 2.2% |
| South American Indians | 11.0 /100 | #207 | Poor 2.2% |
| Uruguayans | 11.0 /100 | #208 | Poor 2.2% |
| Immigrants | Oceania | 10.2 /100 | #209 | Poor 2.2% |
| Natives/Alaskans | 10.0 /100 | #210 | Tragic 2.2% |
Demographics Similar to Alaska Natives by No Schooling Completed
In terms of no schooling completed, the demographic groups most similar to Alaska Natives are Chinese (1.5%, a difference of 0.090%), European (1.5%, a difference of 0.25%), Welsh (1.5%, a difference of 0.46%), Alaskan Athabascan (1.5%, a difference of 0.58%), and Pennsylvania German (1.5%, a difference of 0.61%).
| Demographics | Rating | Rank | No Schooling Completed |
| Tlingit-Haida | 100.0 /100 | #15 | Exceptional 1.5% |
| Finns | 100.0 /100 | #16 | Exceptional 1.5% |
| Croatians | 100.0 /100 | #17 | Exceptional 1.5% |
| Danes | 100.0 /100 | #18 | Exceptional 1.5% |
| Alaskan Athabascans | 100.0 /100 | #19 | Exceptional 1.5% |
| Welsh | 100.0 /100 | #20 | Exceptional 1.5% |
| Chinese | 100.0 /100 | #21 | Exceptional 1.5% |
| Alaska Natives | 100.0 /100 | #22 | Exceptional 1.5% |
| Europeans | 100.0 /100 | #23 | Exceptional 1.5% |
| Pennsylvania Germans | 100.0 /100 | #24 | Exceptional 1.5% |
| French | 100.0 /100 | #25 | Exceptional 1.5% |
| Czechs | 100.0 /100 | #26 | Exceptional 1.5% |
| Scandinavians | 100.0 /100 | #27 | Exceptional 1.5% |
| French Canadians | 100.0 /100 | #28 | Exceptional 1.5% |
| Lumbee | 100.0 /100 | #29 | Exceptional 1.5% |