Norwegian vs Alaska Native In Labor Force | Age 25-29
COMPARE
Norwegian
Alaska Native
In Labor Force | Age 25-29
In Labor Force | Age 25-29 Comparison
Norwegians
Alaska Natives
86.1%
IN LABOR FORCE | AGE 25-29
100.0/ 100
METRIC RATING
13th/ 347
METRIC RANK
81.6%
IN LABOR FORCE | AGE 25-29
0.0/ 100
METRIC RATING
323rd/ 347
METRIC RANK
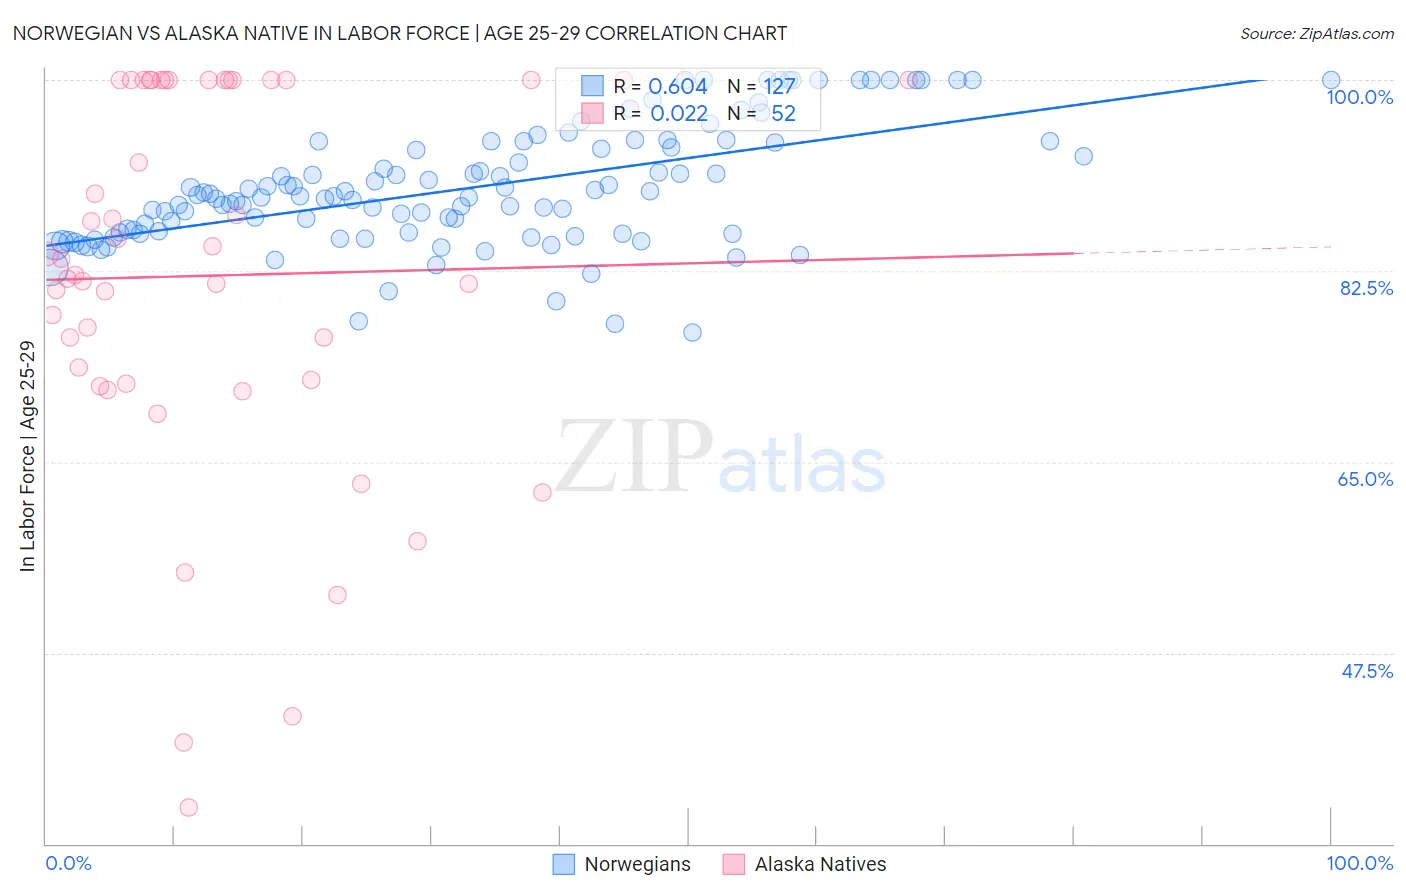
Norwegian vs Alaska Native In Labor Force | Age 25-29 Correlation Chart
The statistical analysis conducted on geographies consisting of 532,549,963 people shows a significant positive correlation between the proportion of Norwegians and labor force participation rate among population between the ages 25 and 29 in the United States with a correlation coefficient (R) of 0.604 and weighted average of 86.1%. Similarly, the statistical analysis conducted on geographies consisting of 76,769,069 people shows no correlation between the proportion of Alaska Natives and labor force participation rate among population between the ages 25 and 29 in the United States with a correlation coefficient (R) of 0.022 and weighted average of 81.6%, a difference of 5.6%.
In Labor Force | Age 25-29 Correlation Summary
| Measurement | Norwegian | Alaska Native |
| Minimum | 76.8% | 33.3% |
| Maximum | 100.0% | 100.0% |
| Range | 23.2% | 66.7% |
| Mean | 90.1% | 82.1% |
| Median | 89.3% | 82.8% |
| Interquartile 25% (IQ1) | 85.9% | 72.3% |
| Interquartile 75% (IQ3) | 94.3% | 100.0% |
| Interquartile Range (IQR) | 8.4% | 27.7% |
| Standard Deviation (Sample) | 5.5% | 17.4% |
| Standard Deviation (Population) | 5.4% | 17.2% |
Similar Demographics by In Labor Force | Age 25-29
Demographics Similar to Norwegians by In Labor Force | Age 25-29
In terms of in labor force | age 25-29, the demographic groups most similar to Norwegians are Immigrants from Lithuania (86.1%, a difference of 0.010%), Immigrants from Ethiopia (86.1%, a difference of 0.020%), Liberian (86.1%, a difference of 0.030%), Latvian (86.1%, a difference of 0.030%), and Bolivian (86.1%, a difference of 0.030%).
| Demographics | Rating | Rank | In Labor Force | Age 25-29 |
| Slovenes | 100.0 /100 | #6 | Exceptional 86.4% |
| Immigrants | Bosnia and Herzegovina | 100.0 /100 | #7 | Exceptional 86.3% |
| Immigrants | Cabo Verde | 100.0 /100 | #8 | Exceptional 86.2% |
| Ethiopians | 100.0 /100 | #9 | Exceptional 86.2% |
| Liberians | 100.0 /100 | #10 | Exceptional 86.1% |
| Immigrants | Ethiopia | 100.0 /100 | #11 | Exceptional 86.1% |
| Immigrants | Lithuania | 100.0 /100 | #12 | Exceptional 86.1% |
| Norwegians | 100.0 /100 | #13 | Exceptional 86.1% |
| Latvians | 100.0 /100 | #14 | Exceptional 86.1% |
| Bolivians | 100.0 /100 | #15 | Exceptional 86.1% |
| Immigrants | Bolivia | 100.0 /100 | #16 | Exceptional 86.1% |
| Bermudans | 100.0 /100 | #17 | Exceptional 86.0% |
| Bulgarians | 100.0 /100 | #18 | Exceptional 86.0% |
| Cape Verdeans | 100.0 /100 | #19 | Exceptional 86.0% |
| Immigrants | Ireland | 100.0 /100 | #20 | Exceptional 86.0% |
Demographics Similar to Alaska Natives by In Labor Force | Age 25-29
In terms of in labor force | age 25-29, the demographic groups most similar to Alaska Natives are Kiowa (81.6%, a difference of 0.050%), Shoshone (81.6%, a difference of 0.060%), Colville (81.6%, a difference of 0.11%), Seminole (81.7%, a difference of 0.16%), and Comanche (81.9%, a difference of 0.38%).
| Demographics | Rating | Rank | In Labor Force | Age 25-29 |
| Mexicans | 0.0 /100 | #316 | Tragic 81.9% |
| Chickasaw | 0.0 /100 | #317 | Tragic 81.9% |
| Comanche | 0.0 /100 | #318 | Tragic 81.9% |
| Seminole | 0.0 /100 | #319 | Tragic 81.7% |
| Colville | 0.0 /100 | #320 | Tragic 81.6% |
| Shoshone | 0.0 /100 | #321 | Tragic 81.6% |
| Kiowa | 0.0 /100 | #322 | Tragic 81.6% |
| Alaska Natives | 0.0 /100 | #323 | Tragic 81.6% |
| Houma | 0.0 /100 | #324 | Tragic 81.2% |
| Dutch West Indians | 0.0 /100 | #325 | Tragic 81.1% |
| Choctaw | 0.0 /100 | #326 | Tragic 81.0% |
| Ute | 0.0 /100 | #327 | Tragic 80.8% |
| Creek | 0.0 /100 | #328 | Tragic 80.7% |
| Yakama | 0.0 /100 | #329 | Tragic 80.6% |
| Puerto Ricans | 0.0 /100 | #330 | Tragic 80.4% |