Immigrants from Zaire vs Guatemalan 10th Grade
COMPARE
Immigrants from Zaire
Guatemalan
10th Grade
10th Grade Comparison
Immigrants from Zaire
Guatemalans
93.4%
10TH GRADE
16.7/ 100
METRIC RATING
212th/ 347
METRIC RANK
87.9%
10TH GRADE
0.0/ 100
METRIC RATING
339th/ 347
METRIC RANK
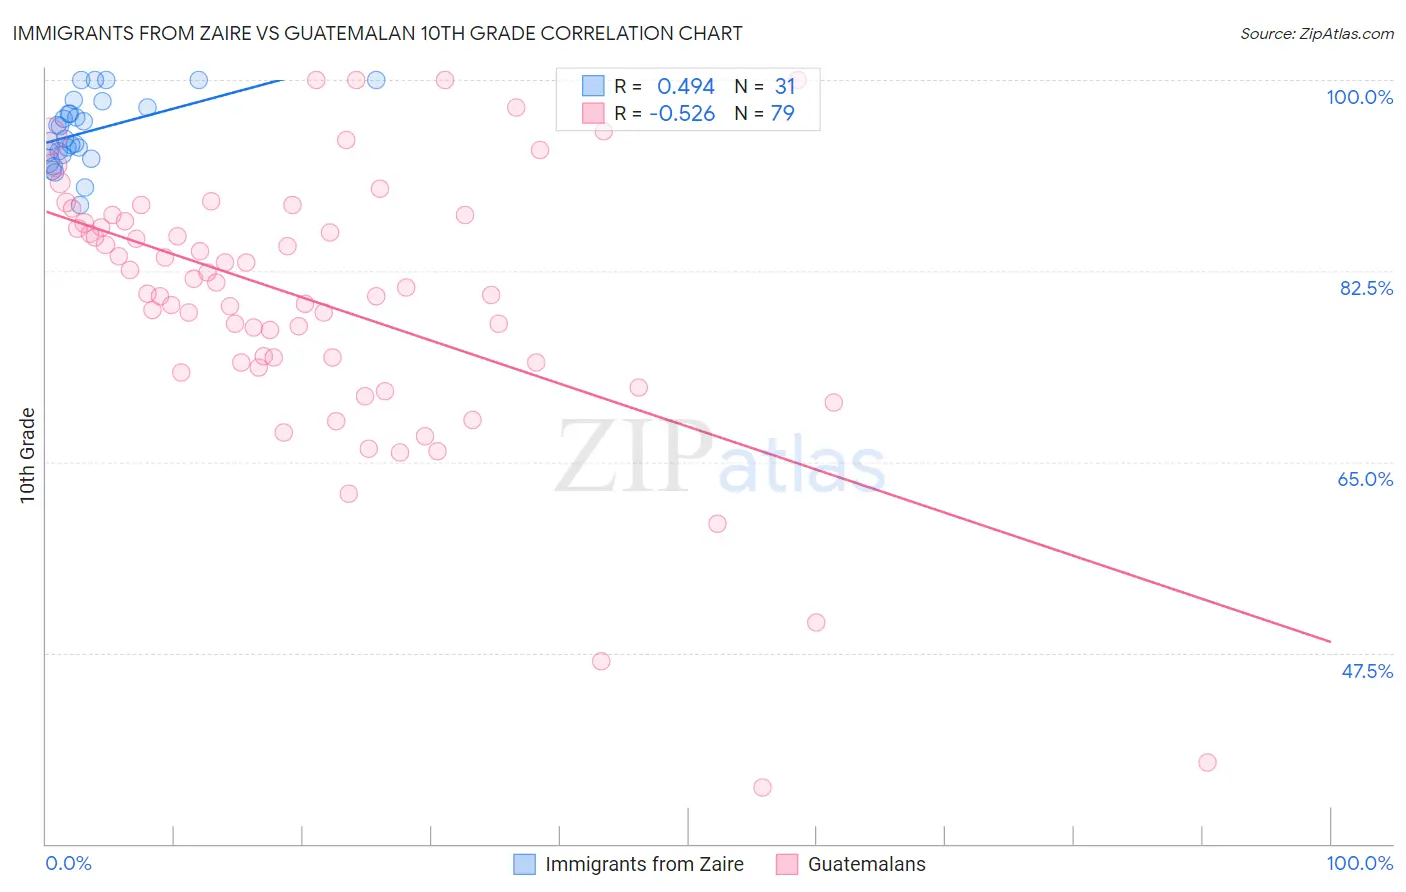
Immigrants from Zaire vs Guatemalan 10th Grade Correlation Chart
The statistical analysis conducted on geographies consisting of 107,212,695 people shows a moderate positive correlation between the proportion of Immigrants from Zaire and percentage of population with at least 10th grade education in the United States with a correlation coefficient (R) of 0.494 and weighted average of 93.4%. Similarly, the statistical analysis conducted on geographies consisting of 409,566,618 people shows a substantial negative correlation between the proportion of Guatemalans and percentage of population with at least 10th grade education in the United States with a correlation coefficient (R) of -0.526 and weighted average of 87.9%, a difference of 6.2%.
10th Grade Correlation Summary
| Measurement | Immigrants from Zaire | Guatemalan |
| Minimum | 88.6% | 35.2% |
| Maximum | 100.0% | 100.0% |
| Range | 11.4% | 64.8% |
| Mean | 95.3% | 79.6% |
| Median | 94.6% | 81.0% |
| Interquartile 25% (IQ1) | 93.1% | 74.1% |
| Interquartile 75% (IQ3) | 97.5% | 87.0% |
| Interquartile Range (IQR) | 4.4% | 12.9% |
| Standard Deviation (Sample) | 3.1% | 12.6% |
| Standard Deviation (Population) | 3.0% | 12.5% |
Similar Demographics by 10th Grade
Demographics Similar to Immigrants from Zaire by 10th Grade
In terms of 10th grade, the demographic groups most similar to Immigrants from Zaire are Cajun (93.4%, a difference of 0.0%), Indian (Asian) (93.4%, a difference of 0.010%), Immigrants from Asia (93.4%, a difference of 0.020%), Immigrants from Bahamas (93.4%, a difference of 0.020%), and Immigrants from Chile (93.4%, a difference of 0.030%).
| Demographics | Rating | Rank | 10th Grade |
| Immigrants | Indonesia | 20.2 /100 | #205 | Fair 93.4% |
| Immigrants | Sudan | 20.0 /100 | #206 | Fair 93.4% |
| Samoans | 19.5 /100 | #207 | Poor 93.4% |
| Immigrants | Syria | 19.4 /100 | #208 | Poor 93.4% |
| Immigrants | Chile | 18.8 /100 | #209 | Poor 93.4% |
| Indians (Asian) | 17.6 /100 | #210 | Poor 93.4% |
| Cajuns | 16.9 /100 | #211 | Poor 93.4% |
| Immigrants | Zaire | 16.7 /100 | #212 | Poor 93.4% |
| Immigrants | Asia | 15.7 /100 | #213 | Poor 93.4% |
| Immigrants | Bahamas | 15.2 /100 | #214 | Poor 93.4% |
| Immigrants | Oceania | 15.1 /100 | #215 | Poor 93.4% |
| Immigrants | Eastern Africa | 14.7 /100 | #216 | Poor 93.4% |
| Portuguese | 12.1 /100 | #217 | Poor 93.3% |
| Immigrants | Liberia | 10.2 /100 | #218 | Poor 93.3% |
| Seminole | 10.2 /100 | #219 | Poor 93.3% |
Demographics Similar to Guatemalans by 10th Grade
In terms of 10th grade, the demographic groups most similar to Guatemalans are Mexican (87.8%, a difference of 0.16%), Salvadoran (87.5%, a difference of 0.44%), Immigrants from Latin America (88.3%, a difference of 0.49%), Central American (88.4%, a difference of 0.56%), and Immigrants from Guatemala (87.4%, a difference of 0.60%).
| Demographics | Rating | Rank | 10th Grade |
| Immigrants | Azores | 0.0 /100 | #332 | Tragic 89.0% |
| Hondurans | 0.0 /100 | #333 | Tragic 89.0% |
| Hispanics or Latinos | 0.0 /100 | #334 | Tragic 88.9% |
| Immigrants | Dominican Republic | 0.0 /100 | #335 | Tragic 88.7% |
| Immigrants | Honduras | 0.0 /100 | #336 | Tragic 88.5% |
| Central Americans | 0.0 /100 | #337 | Tragic 88.4% |
| Immigrants | Latin America | 0.0 /100 | #338 | Tragic 88.3% |
| Guatemalans | 0.0 /100 | #339 | Tragic 87.9% |
| Mexicans | 0.0 /100 | #340 | Tragic 87.8% |
| Salvadorans | 0.0 /100 | #341 | Tragic 87.5% |
| Immigrants | Guatemala | 0.0 /100 | #342 | Tragic 87.4% |
| Yakama | 0.0 /100 | #343 | Tragic 86.9% |
| Immigrants | El Salvador | 0.0 /100 | #344 | Tragic 86.8% |
| Immigrants | Central America | 0.0 /100 | #345 | Tragic 86.6% |
| Spanish American Indians | 0.0 /100 | #346 | Tragic 86.2% |