Nonimmigrants vs Guatemalan Unemployment Among Ages 30 to 34 years
COMPARE
Nonimmigrants
Guatemalan
Unemployment Among Ages 30 to 34 years
Unemployment Among Ages 30 to 34 years Comparison
Nonimmigrants
Guatemalans
6.1%
UNEMPLOYMENT AMONG AGES 30 TO 34 YEARS
0.2/ 100
METRIC RATING
253rd/ 347
METRIC RANK
6.0%
UNEMPLOYMENT AMONG AGES 30 TO 34 YEARS
0.4/ 100
METRIC RATING
242nd/ 347
METRIC RANK
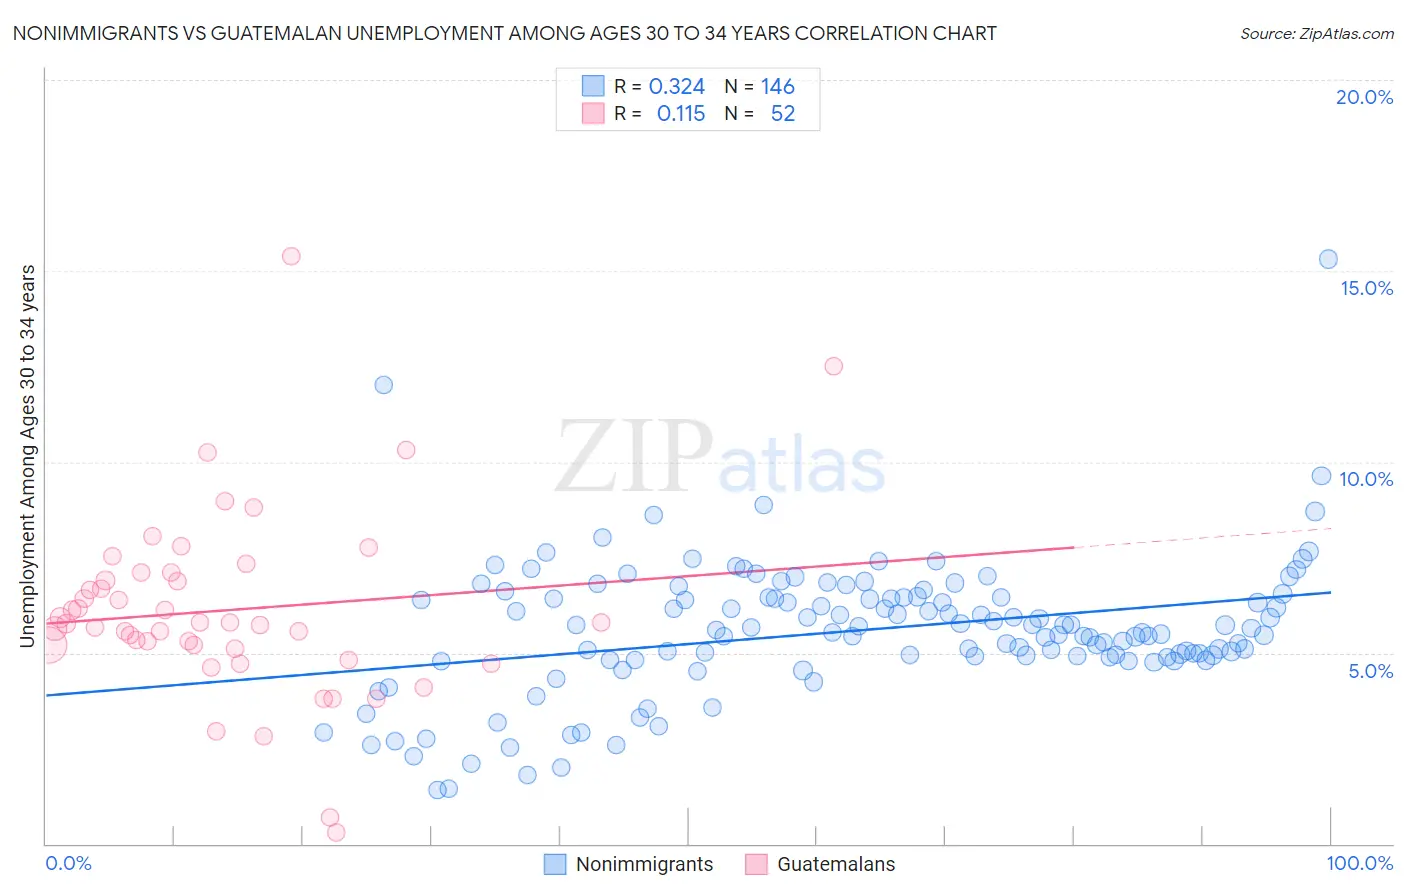
Nonimmigrants vs Guatemalan Unemployment Among Ages 30 to 34 years Correlation Chart
The statistical analysis conducted on geographies consisting of 505,242,058 people shows a mild positive correlation between the proportion of Nonimmigrants and unemployment rate among population between the ages 30 and 34 in the United States with a correlation coefficient (R) of 0.324 and weighted average of 6.1%. Similarly, the statistical analysis conducted on geographies consisting of 387,034,682 people shows a poor positive correlation between the proportion of Guatemalans and unemployment rate among population between the ages 30 and 34 in the United States with a correlation coefficient (R) of 0.115 and weighted average of 6.0%, a difference of 1.1%.
Unemployment Among Ages 30 to 34 years Correlation Summary
| Measurement | Nonimmigrants | Guatemalan |
| Minimum | 1.4% | 0.30% |
| Maximum | 15.3% | 15.4% |
| Range | 13.9% | 15.1% |
| Mean | 5.6% | 6.1% |
| Median | 5.6% | 5.8% |
| Interquartile 25% (IQ1) | 4.9% | 5.1% |
| Interquartile 75% (IQ3) | 6.5% | 7.0% |
| Interquartile Range (IQR) | 1.6% | 1.9% |
| Standard Deviation (Sample) | 1.8% | 2.5% |
| Standard Deviation (Population) | 1.8% | 2.5% |
Demographics Similar to Nonimmigrants and Guatemalans by Unemployment Among Ages 30 to 34 years
In terms of unemployment among ages 30 to 34 years, the demographic groups most similar to Nonimmigrants are Potawatomi (6.0%, a difference of 0.34%), Tlingit-Haida (6.0%, a difference of 0.36%), Immigrants from Honduras (6.0%, a difference of 0.55%), Armenian (6.1%, a difference of 0.63%), and Immigrants from Guatemala (6.0%, a difference of 0.65%). Similarly, the demographic groups most similar to Guatemalans are Immigrants from Liberia (6.0%, a difference of 0.060%), Immigrants from Micronesia (6.0%, a difference of 0.21%), Immigrants from El Salvador (6.0%, a difference of 0.22%), Subsaharan African (6.0%, a difference of 0.23%), and Salvadoran (6.0%, a difference of 0.30%).
| Demographics | Rating | Rank | Unemployment Among Ages 30 to 34 years |
| Central Americans | 0.6 /100 | #237 | Tragic 5.9% |
| Mexican American Indians | 0.6 /100 | #238 | Tragic 5.9% |
| Immigrants | Nigeria | 0.6 /100 | #239 | Tragic 6.0% |
| Salvadorans | 0.5 /100 | #240 | Tragic 6.0% |
| Immigrants | El Salvador | 0.5 /100 | #241 | Tragic 6.0% |
| Guatemalans | 0.4 /100 | #242 | Tragic 6.0% |
| Immigrants | Liberia | 0.4 /100 | #243 | Tragic 6.0% |
| Immigrants | Micronesia | 0.3 /100 | #244 | Tragic 6.0% |
| Sub-Saharan Africans | 0.3 /100 | #245 | Tragic 6.0% |
| Ghanaians | 0.3 /100 | #246 | Tragic 6.0% |
| Nigerians | 0.3 /100 | #247 | Tragic 6.0% |
| Immigrants | Guatemala | 0.3 /100 | #248 | Tragic 6.0% |
| Hondurans | 0.3 /100 | #249 | Tragic 6.0% |
| Immigrants | Honduras | 0.3 /100 | #250 | Tragic 6.0% |
| Tlingit-Haida | 0.2 /100 | #251 | Tragic 6.0% |
| Potawatomi | 0.2 /100 | #252 | Tragic 6.0% |
| Immigrants | Nonimmigrants | 0.2 /100 | #253 | Tragic 6.1% |
| Armenians | 0.1 /100 | #254 | Tragic 6.1% |
| Immigrants | Portugal | 0.1 /100 | #255 | Tragic 6.1% |
| Immigrants | Ghana | 0.1 /100 | #256 | Tragic 6.1% |
| Immigrants | Sierra Leone | 0.1 /100 | #257 | Tragic 6.1% |