Immigrants from Barbados vs Guatemalan 10th Grade
COMPARE
Immigrants from Barbados
Guatemalan
10th Grade
10th Grade Comparison
Immigrants from Barbados
Guatemalans
92.1%
10TH GRADE
0.0/ 100
METRIC RATING
284th/ 347
METRIC RANK
87.9%
10TH GRADE
0.0/ 100
METRIC RATING
339th/ 347
METRIC RANK
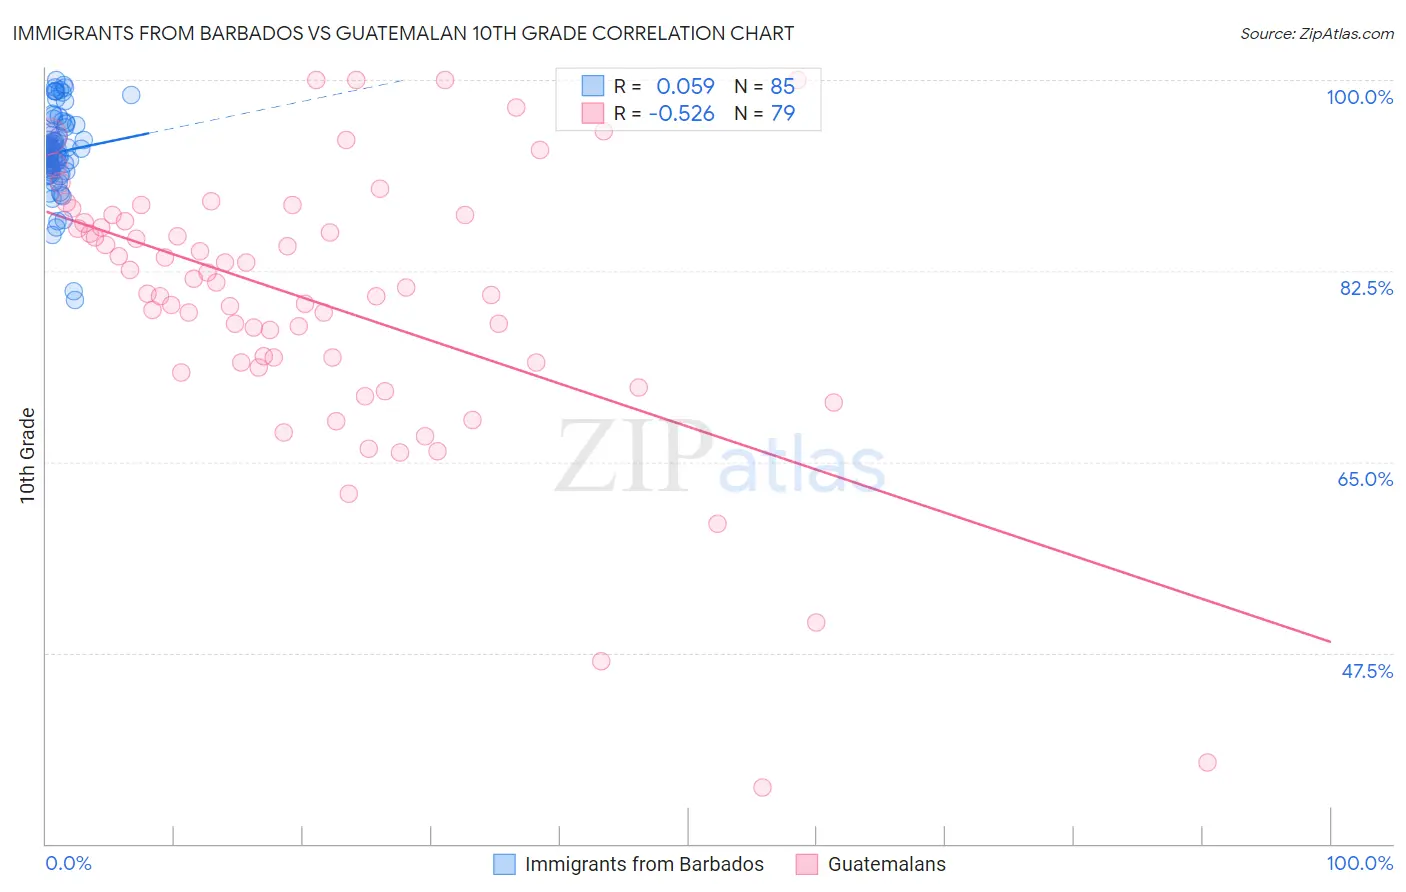
Immigrants from Barbados vs Guatemalan 10th Grade Correlation Chart
The statistical analysis conducted on geographies consisting of 112,782,130 people shows a slight positive correlation between the proportion of Immigrants from Barbados and percentage of population with at least 10th grade education in the United States with a correlation coefficient (R) of 0.059 and weighted average of 92.1%. Similarly, the statistical analysis conducted on geographies consisting of 409,566,618 people shows a substantial negative correlation between the proportion of Guatemalans and percentage of population with at least 10th grade education in the United States with a correlation coefficient (R) of -0.526 and weighted average of 87.9%, a difference of 4.8%.
10th Grade Correlation Summary
| Measurement | Immigrants from Barbados | Guatemalan |
| Minimum | 79.8% | 35.2% |
| Maximum | 100.0% | 100.0% |
| Range | 20.2% | 64.8% |
| Mean | 93.4% | 79.6% |
| Median | 93.2% | 81.0% |
| Interquartile 25% (IQ1) | 91.9% | 74.1% |
| Interquartile 75% (IQ3) | 95.4% | 87.0% |
| Interquartile Range (IQR) | 3.6% | 12.9% |
| Standard Deviation (Sample) | 3.7% | 12.6% |
| Standard Deviation (Population) | 3.7% | 12.5% |
Similar Demographics by 10th Grade
Demographics Similar to Immigrants from Barbados by 10th Grade
In terms of 10th grade, the demographic groups most similar to Immigrants from Barbados are Immigrants from St. Vincent and the Grenadines (92.1%, a difference of 0.020%), Immigrants from South Eastern Asia (92.1%, a difference of 0.020%), Yuman (92.0%, a difference of 0.070%), Immigrants from Peru (92.2%, a difference of 0.080%), and Bangladeshi (92.2%, a difference of 0.10%).
| Demographics | Rating | Rank | 10th Grade |
| Navajo | 0.1 /100 | #277 | Tragic 92.3% |
| Barbadians | 0.1 /100 | #278 | Tragic 92.2% |
| Natives/Alaskans | 0.1 /100 | #279 | Tragic 92.2% |
| Malaysians | 0.1 /100 | #280 | Tragic 92.2% |
| Bangladeshis | 0.1 /100 | #281 | Tragic 92.2% |
| Immigrants | Peru | 0.1 /100 | #282 | Tragic 92.2% |
| Immigrants | St. Vincent and the Grenadines | 0.0 /100 | #283 | Tragic 92.1% |
| Immigrants | Barbados | 0.0 /100 | #284 | Tragic 92.1% |
| Immigrants | South Eastern Asia | 0.0 /100 | #285 | Tragic 92.1% |
| Yuman | 0.0 /100 | #286 | Tragic 92.0% |
| Pennsylvania Germans | 0.0 /100 | #287 | Tragic 91.9% |
| Immigrants | Laos | 0.0 /100 | #288 | Tragic 91.9% |
| Sri Lankans | 0.0 /100 | #289 | Tragic 91.8% |
| British West Indians | 0.0 /100 | #290 | Tragic 91.8% |
| Immigrants | West Indies | 0.0 /100 | #291 | Tragic 91.8% |
Demographics Similar to Guatemalans by 10th Grade
In terms of 10th grade, the demographic groups most similar to Guatemalans are Mexican (87.8%, a difference of 0.16%), Salvadoran (87.5%, a difference of 0.44%), Immigrants from Latin America (88.3%, a difference of 0.49%), Central American (88.4%, a difference of 0.56%), and Immigrants from Guatemala (87.4%, a difference of 0.60%).
| Demographics | Rating | Rank | 10th Grade |
| Immigrants | Azores | 0.0 /100 | #332 | Tragic 89.0% |
| Hondurans | 0.0 /100 | #333 | Tragic 89.0% |
| Hispanics or Latinos | 0.0 /100 | #334 | Tragic 88.9% |
| Immigrants | Dominican Republic | 0.0 /100 | #335 | Tragic 88.7% |
| Immigrants | Honduras | 0.0 /100 | #336 | Tragic 88.5% |
| Central Americans | 0.0 /100 | #337 | Tragic 88.4% |
| Immigrants | Latin America | 0.0 /100 | #338 | Tragic 88.3% |
| Guatemalans | 0.0 /100 | #339 | Tragic 87.9% |
| Mexicans | 0.0 /100 | #340 | Tragic 87.8% |
| Salvadorans | 0.0 /100 | #341 | Tragic 87.5% |
| Immigrants | Guatemala | 0.0 /100 | #342 | Tragic 87.4% |
| Yakama | 0.0 /100 | #343 | Tragic 86.9% |
| Immigrants | El Salvador | 0.0 /100 | #344 | Tragic 86.8% |
| Immigrants | Central America | 0.0 /100 | #345 | Tragic 86.6% |
| Spanish American Indians | 0.0 /100 | #346 | Tragic 86.2% |