Nigerian vs Immigrants from Cuba 4th Grade
COMPARE
Nigerian
Immigrants from Cuba
4th Grade
4th Grade Comparison
Nigerians
Immigrants from Cuba
97.1%
4TH GRADE
1.8/ 100
METRIC RATING
239th/ 347
METRIC RANK
96.4%
4TH GRADE
0.0/ 100
METRIC RATING
302nd/ 347
METRIC RANK
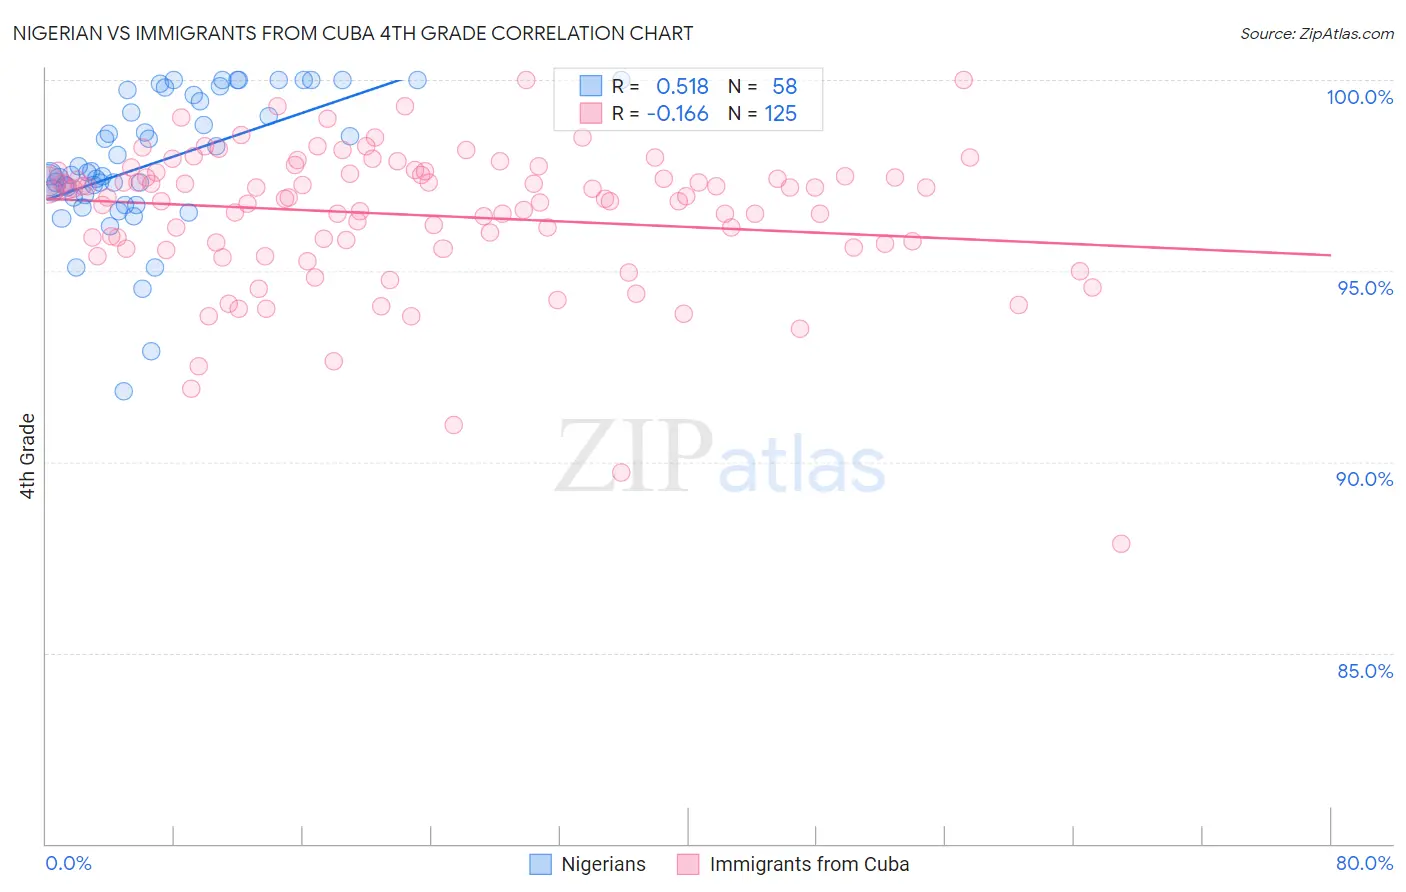
Nigerian vs Immigrants from Cuba 4th Grade Correlation Chart
The statistical analysis conducted on geographies consisting of 332,724,627 people shows a substantial positive correlation between the proportion of Nigerians and percentage of population with at least 4th grade education in the United States with a correlation coefficient (R) of 0.518 and weighted average of 97.1%. Similarly, the statistical analysis conducted on geographies consisting of 326,028,159 people shows a poor negative correlation between the proportion of Immigrants from Cuba and percentage of population with at least 4th grade education in the United States with a correlation coefficient (R) of -0.166 and weighted average of 96.4%, a difference of 0.74%.
4th Grade Correlation Summary
| Measurement | Nigerian | Immigrants from Cuba |
| Minimum | 91.9% | 87.9% |
| Maximum | 100.0% | 100.0% |
| Range | 8.1% | 12.1% |
| Mean | 97.9% | 96.5% |
| Median | 97.6% | 96.9% |
| Interquartile 25% (IQ1) | 97.0% | 95.7% |
| Interquartile 75% (IQ3) | 99.6% | 97.6% |
| Interquartile Range (IQR) | 2.6% | 1.9% |
| Standard Deviation (Sample) | 1.8% | 1.9% |
| Standard Deviation (Population) | 1.8% | 1.9% |
Similar Demographics by 4th Grade
Demographics Similar to Nigerians by 4th Grade
In terms of 4th grade, the demographic groups most similar to Nigerians are Immigrants from Costa Rica (97.2%, a difference of 0.010%), Indian (Asian) (97.2%, a difference of 0.010%), Colombian (97.1%, a difference of 0.010%), Immigrants from Indonesia (97.1%, a difference of 0.010%), and Asian (97.1%, a difference of 0.020%).
| Demographics | Rating | Rank | 4th Grade |
| Immigrants | Western Asia | 3.4 /100 | #232 | Tragic 97.2% |
| Senegalese | 3.1 /100 | #233 | Tragic 97.2% |
| Assyrians/Chaldeans/Syriacs | 3.0 /100 | #234 | Tragic 97.2% |
| Yuman | 2.9 /100 | #235 | Tragic 97.2% |
| Immigrants | Eastern Asia | 2.7 /100 | #236 | Tragic 97.2% |
| Immigrants | Costa Rica | 2.0 /100 | #237 | Tragic 97.2% |
| Indians (Asian) | 1.9 /100 | #238 | Tragic 97.2% |
| Nigerians | 1.8 /100 | #239 | Tragic 97.1% |
| Colombians | 1.6 /100 | #240 | Tragic 97.1% |
| Immigrants | Indonesia | 1.5 /100 | #241 | Tragic 97.1% |
| Asians | 1.4 /100 | #242 | Tragic 97.1% |
| U.S. Virgin Islanders | 1.4 /100 | #243 | Tragic 97.1% |
| Koreans | 1.3 /100 | #244 | Tragic 97.1% |
| Immigrants | Eastern Africa | 1.2 /100 | #245 | Tragic 97.1% |
| Immigrants | Uruguay | 1.2 /100 | #246 | Tragic 97.1% |
Demographics Similar to Immigrants from Cuba by 4th Grade
In terms of 4th grade, the demographic groups most similar to Immigrants from Cuba are Immigrants (96.5%, a difference of 0.030%), Guyanese (96.4%, a difference of 0.050%), Ecuadorian (96.4%, a difference of 0.060%), Immigrants from Caribbean (96.4%, a difference of 0.070%), and Immigrants from South Eastern Asia (96.5%, a difference of 0.080%).
| Demographics | Rating | Rank | 4th Grade |
| Immigrants | Portugal | 0.0 /100 | #295 | Tragic 96.6% |
| Somalis | 0.0 /100 | #296 | Tragic 96.6% |
| Immigrants | Somalia | 0.0 /100 | #297 | Tragic 96.5% |
| Haitians | 0.0 /100 | #298 | Tragic 96.5% |
| Immigrants | Dominica | 0.0 /100 | #299 | Tragic 96.5% |
| Immigrants | South Eastern Asia | 0.0 /100 | #300 | Tragic 96.5% |
| Immigrants | Immigrants | 0.0 /100 | #301 | Tragic 96.5% |
| Immigrants | Cuba | 0.0 /100 | #302 | Tragic 96.4% |
| Guyanese | 0.0 /100 | #303 | Tragic 96.4% |
| Ecuadorians | 0.0 /100 | #304 | Tragic 96.4% |
| Immigrants | Caribbean | 0.0 /100 | #305 | Tragic 96.4% |
| Sri Lankans | 0.0 /100 | #306 | Tragic 96.4% |
| Immigrants | Haiti | 0.0 /100 | #307 | Tragic 96.3% |
| Immigrants | Laos | 0.0 /100 | #308 | Tragic 96.3% |
| Immigrants | Guyana | 0.0 /100 | #309 | Tragic 96.3% |