Mexican vs Immigrants from Cuba 4th Grade
COMPARE
Mexican
Immigrants from Cuba
4th Grade
4th Grade Comparison
Mexicans
Immigrants from Cuba
95.6%
4TH GRADE
0.0/ 100
METRIC RATING
336th/ 347
METRIC RANK
96.4%
4TH GRADE
0.0/ 100
METRIC RATING
302nd/ 347
METRIC RANK
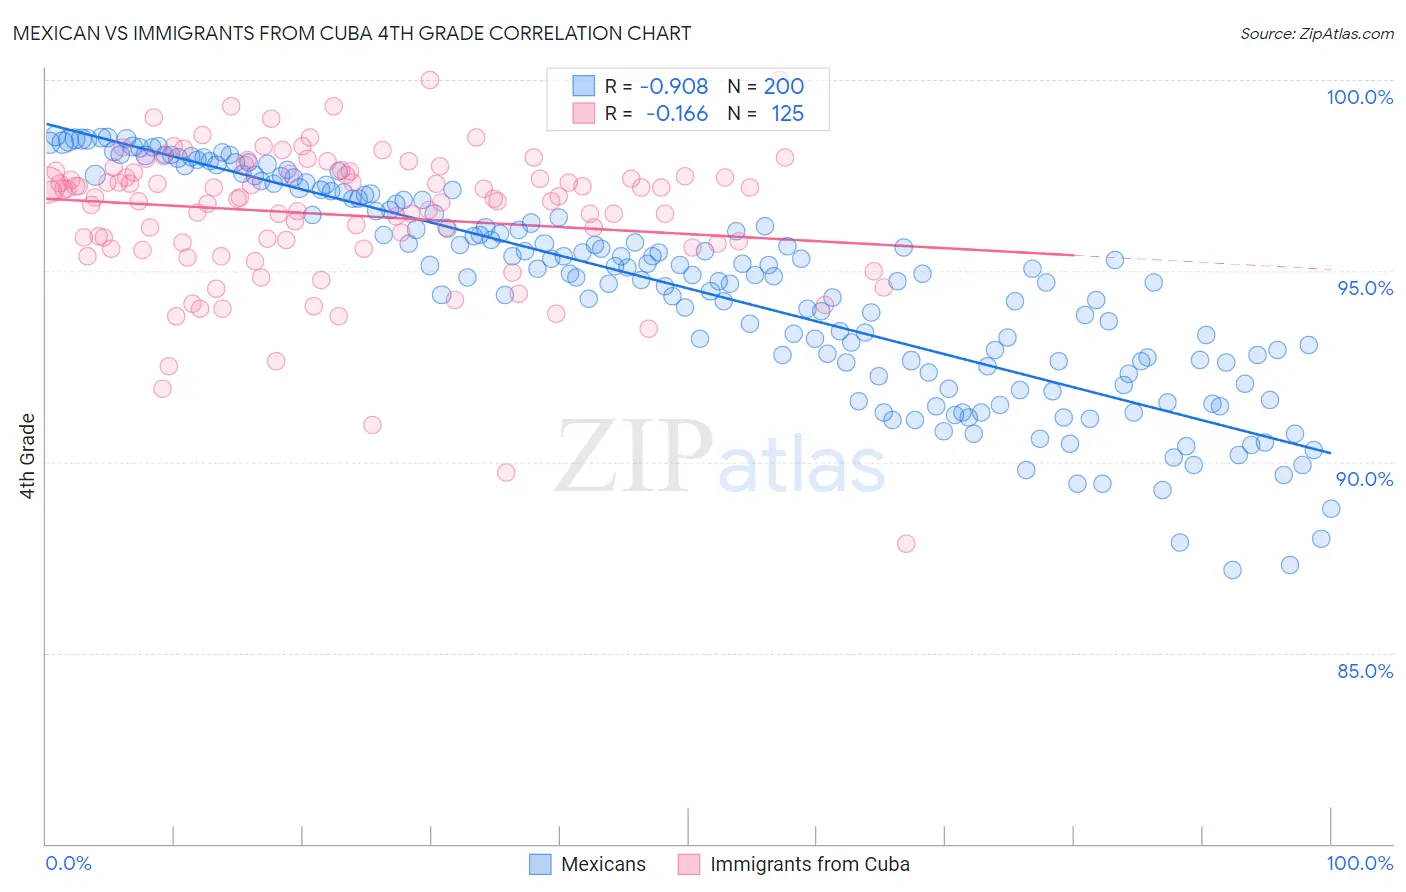
Mexican vs Immigrants from Cuba 4th Grade Correlation Chart
The statistical analysis conducted on geographies consisting of 565,340,380 people shows a near-perfect negative correlation between the proportion of Mexicans and percentage of population with at least 4th grade education in the United States with a correlation coefficient (R) of -0.908 and weighted average of 95.6%. Similarly, the statistical analysis conducted on geographies consisting of 326,028,159 people shows a poor negative correlation between the proportion of Immigrants from Cuba and percentage of population with at least 4th grade education in the United States with a correlation coefficient (R) of -0.166 and weighted average of 96.4%, a difference of 0.87%.
4th Grade Correlation Summary
| Measurement | Mexican | Immigrants from Cuba |
| Minimum | 87.2% | 87.9% |
| Maximum | 98.5% | 100.0% |
| Range | 11.4% | 12.1% |
| Mean | 94.5% | 96.5% |
| Median | 94.9% | 96.9% |
| Interquartile 25% (IQ1) | 92.6% | 95.7% |
| Interquartile 75% (IQ3) | 96.9% | 97.6% |
| Interquartile Range (IQR) | 4.3% | 1.9% |
| Standard Deviation (Sample) | 2.7% | 1.9% |
| Standard Deviation (Population) | 2.7% | 1.9% |
Similar Demographics by 4th Grade
Demographics Similar to Mexicans by 4th Grade
In terms of 4th grade, the demographic groups most similar to Mexicans are Immigrants from Latin America (95.7%, a difference of 0.070%), Immigrants from Dominican Republic (95.7%, a difference of 0.13%), Immigrants from Cabo Verde (95.7%, a difference of 0.13%), Central American (95.5%, a difference of 0.13%), and Nepalese (95.5%, a difference of 0.13%).
| Demographics | Rating | Rank | 4th Grade |
| Immigrants | Cambodia | 0.0 /100 | #329 | Tragic 95.8% |
| Immigrants | Fiji | 0.0 /100 | #330 | Tragic 95.8% |
| Immigrants | Armenia | 0.0 /100 | #331 | Tragic 95.8% |
| Immigrants | Honduras | 0.0 /100 | #332 | Tragic 95.8% |
| Immigrants | Dominican Republic | 0.0 /100 | #333 | Tragic 95.7% |
| Immigrants | Cabo Verde | 0.0 /100 | #334 | Tragic 95.7% |
| Immigrants | Latin America | 0.0 /100 | #335 | Tragic 95.7% |
| Mexicans | 0.0 /100 | #336 | Tragic 95.6% |
| Central Americans | 0.0 /100 | #337 | Tragic 95.5% |
| Nepalese | 0.0 /100 | #338 | Tragic 95.5% |
| Guatemalans | 0.0 /100 | #339 | Tragic 95.3% |
| Yakama | 0.0 /100 | #340 | Tragic 95.2% |
| Immigrants | Yemen | 0.0 /100 | #341 | Tragic 95.2% |
| Immigrants | Central America | 0.0 /100 | #342 | Tragic 95.1% |
| Immigrants | Guatemala | 0.0 /100 | #343 | Tragic 95.1% |
Demographics Similar to Immigrants from Cuba by 4th Grade
In terms of 4th grade, the demographic groups most similar to Immigrants from Cuba are Immigrants (96.5%, a difference of 0.030%), Guyanese (96.4%, a difference of 0.050%), Ecuadorian (96.4%, a difference of 0.060%), Immigrants from Caribbean (96.4%, a difference of 0.070%), and Immigrants from South Eastern Asia (96.5%, a difference of 0.080%).
| Demographics | Rating | Rank | 4th Grade |
| Immigrants | Portugal | 0.0 /100 | #295 | Tragic 96.6% |
| Somalis | 0.0 /100 | #296 | Tragic 96.6% |
| Immigrants | Somalia | 0.0 /100 | #297 | Tragic 96.5% |
| Haitians | 0.0 /100 | #298 | Tragic 96.5% |
| Immigrants | Dominica | 0.0 /100 | #299 | Tragic 96.5% |
| Immigrants | South Eastern Asia | 0.0 /100 | #300 | Tragic 96.5% |
| Immigrants | Immigrants | 0.0 /100 | #301 | Tragic 96.5% |
| Immigrants | Cuba | 0.0 /100 | #302 | Tragic 96.4% |
| Guyanese | 0.0 /100 | #303 | Tragic 96.4% |
| Ecuadorians | 0.0 /100 | #304 | Tragic 96.4% |
| Immigrants | Caribbean | 0.0 /100 | #305 | Tragic 96.4% |
| Sri Lankans | 0.0 /100 | #306 | Tragic 96.4% |
| Immigrants | Haiti | 0.0 /100 | #307 | Tragic 96.3% |
| Immigrants | Laos | 0.0 /100 | #308 | Tragic 96.3% |
| Immigrants | Guyana | 0.0 /100 | #309 | Tragic 96.3% |