Guamanian/Chamorro vs Immigrants from Cuba 4th Grade
COMPARE
Guamanian/Chamorro
Immigrants from Cuba
4th Grade
4th Grade Comparison
Guamanians/Chamorros
Immigrants from Cuba
97.4%
4TH GRADE
23.0/ 100
METRIC RATING
198th/ 347
METRIC RANK
96.4%
4TH GRADE
0.0/ 100
METRIC RATING
302nd/ 347
METRIC RANK
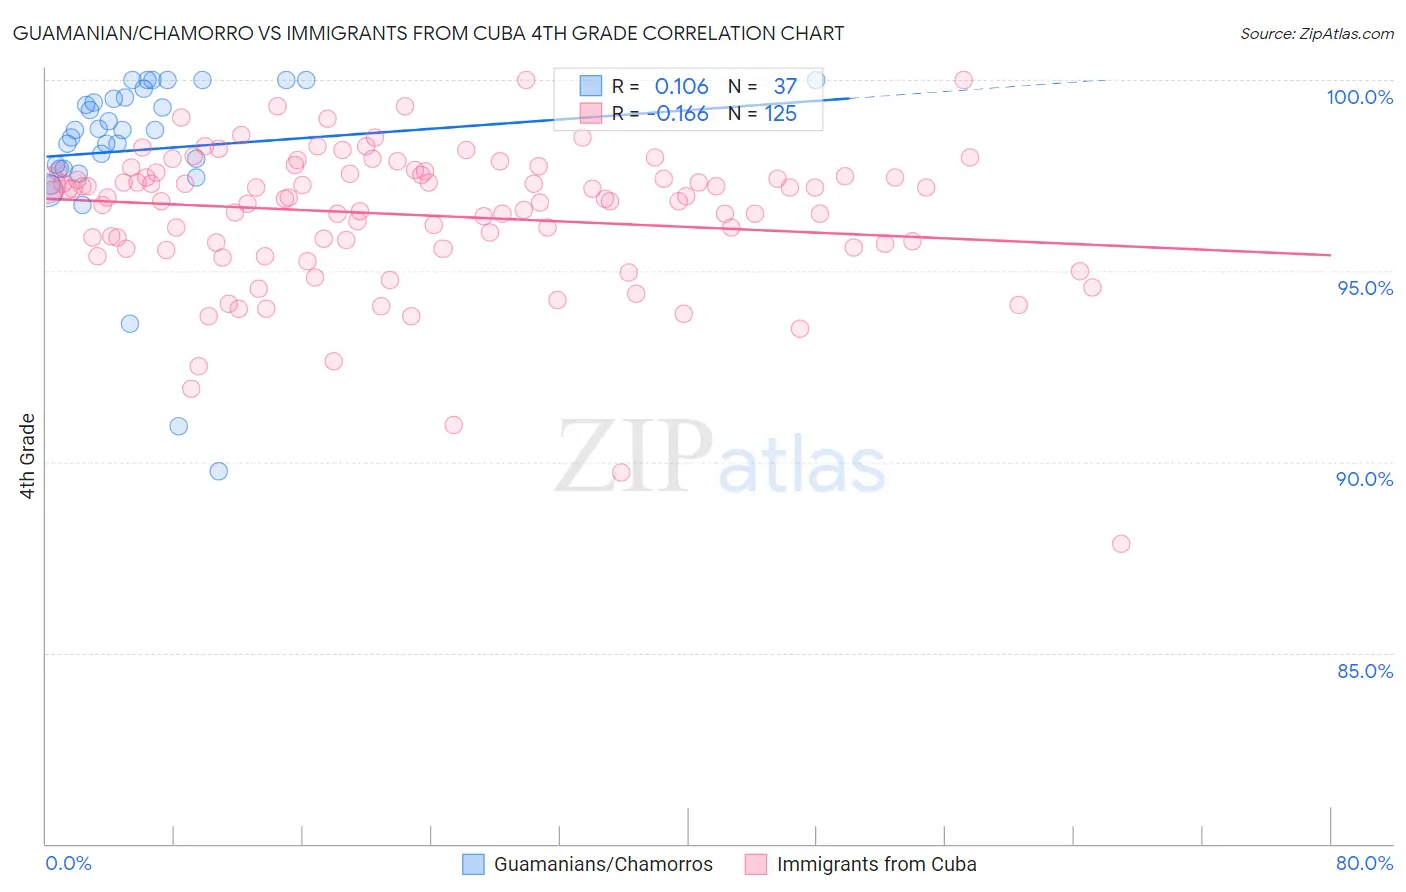
Guamanian/Chamorro vs Immigrants from Cuba 4th Grade Correlation Chart
The statistical analysis conducted on geographies consisting of 221,965,618 people shows a poor positive correlation between the proportion of Guamanians/Chamorros and percentage of population with at least 4th grade education in the United States with a correlation coefficient (R) of 0.106 and weighted average of 97.4%. Similarly, the statistical analysis conducted on geographies consisting of 326,028,159 people shows a poor negative correlation between the proportion of Immigrants from Cuba and percentage of population with at least 4th grade education in the United States with a correlation coefficient (R) of -0.166 and weighted average of 96.4%, a difference of 1.0%.
4th Grade Correlation Summary
| Measurement | Guamanian/Chamorro | Immigrants from Cuba |
| Minimum | 89.7% | 87.9% |
| Maximum | 100.0% | 100.0% |
| Range | 10.3% | 12.1% |
| Mean | 98.2% | 96.5% |
| Median | 98.7% | 96.9% |
| Interquartile 25% (IQ1) | 97.7% | 95.7% |
| Interquartile 75% (IQ3) | 99.6% | 97.6% |
| Interquartile Range (IQR) | 2.0% | 1.9% |
| Standard Deviation (Sample) | 2.3% | 1.9% |
| Standard Deviation (Population) | 2.3% | 1.9% |
Similar Demographics by 4th Grade
Demographics Similar to Guamanians/Chamorros by 4th Grade
In terms of 4th grade, the demographic groups most similar to Guamanians/Chamorros are Hawaiian (97.4%, a difference of 0.010%), Native/Alaskan (97.4%, a difference of 0.010%), Immigrants from Albania (97.4%, a difference of 0.020%), Immigrants from Uganda (97.4%, a difference of 0.020%), and Immigrants from Ukraine (97.4%, a difference of 0.030%).
| Demographics | Rating | Rank | 4th Grade |
| Navajo | 30.7 /100 | #191 | Fair 97.4% |
| Immigrants | Ukraine | 30.1 /100 | #192 | Fair 97.4% |
| Immigrants | Egypt | 30.1 /100 | #193 | Fair 97.4% |
| Portuguese | 29.2 /100 | #194 | Fair 97.4% |
| Paraguayans | 28.9 /100 | #195 | Fair 97.4% |
| Immigrants | Albania | 27.7 /100 | #196 | Fair 97.4% |
| Hawaiians | 25.6 /100 | #197 | Fair 97.4% |
| Guamanians/Chamorros | 23.0 /100 | #198 | Fair 97.4% |
| Natives/Alaskans | 20.6 /100 | #199 | Fair 97.4% |
| Immigrants | Uganda | 19.8 /100 | #200 | Poor 97.4% |
| Immigrants | Southern Europe | 16.2 /100 | #201 | Poor 97.4% |
| Immigrants | Chile | 16.1 /100 | #202 | Poor 97.4% |
| Immigrants | Northern Africa | 15.1 /100 | #203 | Poor 97.4% |
| Africans | 14.6 /100 | #204 | Poor 97.4% |
| Paiute | 13.2 /100 | #205 | Poor 97.3% |
Demographics Similar to Immigrants from Cuba by 4th Grade
In terms of 4th grade, the demographic groups most similar to Immigrants from Cuba are Immigrants (96.5%, a difference of 0.030%), Guyanese (96.4%, a difference of 0.050%), Ecuadorian (96.4%, a difference of 0.060%), Immigrants from Caribbean (96.4%, a difference of 0.070%), and Immigrants from South Eastern Asia (96.5%, a difference of 0.080%).
| Demographics | Rating | Rank | 4th Grade |
| Immigrants | Portugal | 0.0 /100 | #295 | Tragic 96.6% |
| Somalis | 0.0 /100 | #296 | Tragic 96.6% |
| Immigrants | Somalia | 0.0 /100 | #297 | Tragic 96.5% |
| Haitians | 0.0 /100 | #298 | Tragic 96.5% |
| Immigrants | Dominica | 0.0 /100 | #299 | Tragic 96.5% |
| Immigrants | South Eastern Asia | 0.0 /100 | #300 | Tragic 96.5% |
| Immigrants | Immigrants | 0.0 /100 | #301 | Tragic 96.5% |
| Immigrants | Cuba | 0.0 /100 | #302 | Tragic 96.4% |
| Guyanese | 0.0 /100 | #303 | Tragic 96.4% |
| Ecuadorians | 0.0 /100 | #304 | Tragic 96.4% |
| Immigrants | Caribbean | 0.0 /100 | #305 | Tragic 96.4% |
| Sri Lankans | 0.0 /100 | #306 | Tragic 96.4% |
| Immigrants | Haiti | 0.0 /100 | #307 | Tragic 96.3% |
| Immigrants | Laos | 0.0 /100 | #308 | Tragic 96.3% |
| Immigrants | Guyana | 0.0 /100 | #309 | Tragic 96.3% |