Immigrants from El Salvador vs Immigrants from Cuba 4th Grade
COMPARE
Immigrants from El Salvador
Immigrants from Cuba
4th Grade
4th Grade Comparison
Immigrants from El Salvador
Immigrants from Cuba
94.8%
4TH GRADE
0.0/ 100
METRIC RATING
346th/ 347
METRIC RANK
96.4%
4TH GRADE
0.0/ 100
METRIC RATING
302nd/ 347
METRIC RANK
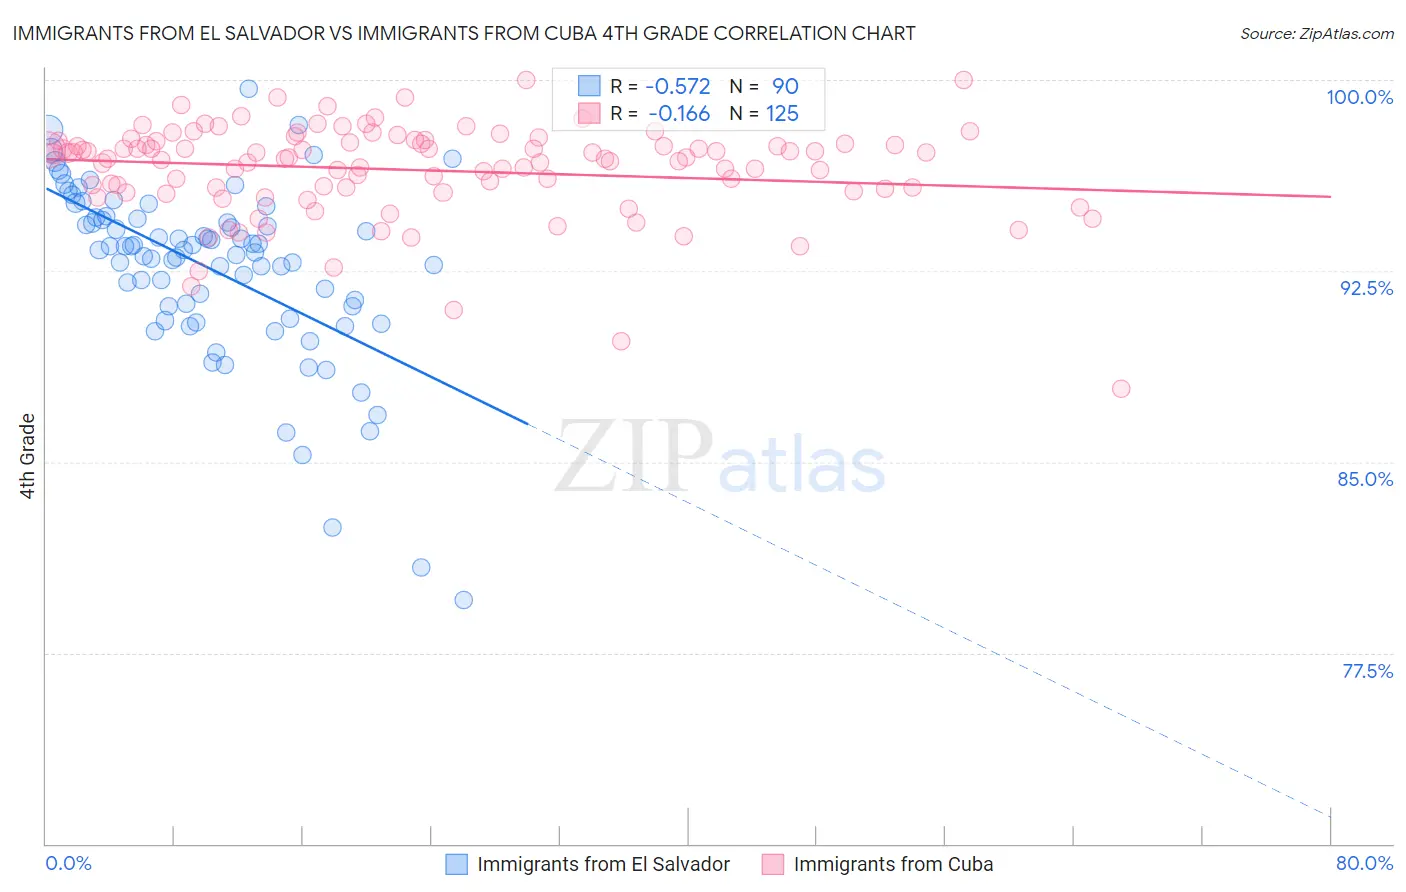
Immigrants from El Salvador vs Immigrants from Cuba 4th Grade Correlation Chart
The statistical analysis conducted on geographies consisting of 357,852,938 people shows a substantial negative correlation between the proportion of Immigrants from El Salvador and percentage of population with at least 4th grade education in the United States with a correlation coefficient (R) of -0.572 and weighted average of 94.8%. Similarly, the statistical analysis conducted on geographies consisting of 326,028,159 people shows a poor negative correlation between the proportion of Immigrants from Cuba and percentage of population with at least 4th grade education in the United States with a correlation coefficient (R) of -0.166 and weighted average of 96.4%, a difference of 1.7%.
4th Grade Correlation Summary
| Measurement | Immigrants from El Salvador | Immigrants from Cuba |
| Minimum | 79.5% | 87.9% |
| Maximum | 99.7% | 100.0% |
| Range | 20.1% | 12.1% |
| Mean | 92.6% | 96.5% |
| Median | 93.3% | 96.9% |
| Interquartile 25% (IQ1) | 91.1% | 95.7% |
| Interquartile 75% (IQ3) | 94.6% | 97.6% |
| Interquartile Range (IQR) | 3.4% | 1.9% |
| Standard Deviation (Sample) | 3.5% | 1.9% |
| Standard Deviation (Population) | 3.5% | 1.9% |
Similar Demographics by 4th Grade
Demographics Similar to Immigrants from El Salvador by 4th Grade
In terms of 4th grade, the demographic groups most similar to Immigrants from El Salvador are Spanish American Indian (94.6%, a difference of 0.18%), Salvadoran (95.0%, a difference of 0.28%), Immigrants from Mexico (95.1%, a difference of 0.29%), Immigrants from Guatemala (95.1%, a difference of 0.32%), and Immigrants from Central America (95.1%, a difference of 0.35%).
| Demographics | Rating | Rank | 4th Grade |
| Immigrants | Dominican Republic | 0.0 /100 | #333 | Tragic 95.7% |
| Immigrants | Cabo Verde | 0.0 /100 | #334 | Tragic 95.7% |
| Immigrants | Latin America | 0.0 /100 | #335 | Tragic 95.7% |
| Mexicans | 0.0 /100 | #336 | Tragic 95.6% |
| Central Americans | 0.0 /100 | #337 | Tragic 95.5% |
| Nepalese | 0.0 /100 | #338 | Tragic 95.5% |
| Guatemalans | 0.0 /100 | #339 | Tragic 95.3% |
| Yakama | 0.0 /100 | #340 | Tragic 95.2% |
| Immigrants | Yemen | 0.0 /100 | #341 | Tragic 95.2% |
| Immigrants | Central America | 0.0 /100 | #342 | Tragic 95.1% |
| Immigrants | Guatemala | 0.0 /100 | #343 | Tragic 95.1% |
| Immigrants | Mexico | 0.0 /100 | #344 | Tragic 95.1% |
| Salvadorans | 0.0 /100 | #345 | Tragic 95.0% |
| Immigrants | El Salvador | 0.0 /100 | #346 | Tragic 94.8% |
| Spanish American Indians | 0.0 /100 | #347 | Tragic 94.6% |
Demographics Similar to Immigrants from Cuba by 4th Grade
In terms of 4th grade, the demographic groups most similar to Immigrants from Cuba are Immigrants (96.5%, a difference of 0.030%), Guyanese (96.4%, a difference of 0.050%), Ecuadorian (96.4%, a difference of 0.060%), Immigrants from Caribbean (96.4%, a difference of 0.070%), and Immigrants from South Eastern Asia (96.5%, a difference of 0.080%).
| Demographics | Rating | Rank | 4th Grade |
| Immigrants | Portugal | 0.0 /100 | #295 | Tragic 96.6% |
| Somalis | 0.0 /100 | #296 | Tragic 96.6% |
| Immigrants | Somalia | 0.0 /100 | #297 | Tragic 96.5% |
| Haitians | 0.0 /100 | #298 | Tragic 96.5% |
| Immigrants | Dominica | 0.0 /100 | #299 | Tragic 96.5% |
| Immigrants | South Eastern Asia | 0.0 /100 | #300 | Tragic 96.5% |
| Immigrants | Immigrants | 0.0 /100 | #301 | Tragic 96.5% |
| Immigrants | Cuba | 0.0 /100 | #302 | Tragic 96.4% |
| Guyanese | 0.0 /100 | #303 | Tragic 96.4% |
| Ecuadorians | 0.0 /100 | #304 | Tragic 96.4% |
| Immigrants | Caribbean | 0.0 /100 | #305 | Tragic 96.4% |
| Sri Lankans | 0.0 /100 | #306 | Tragic 96.4% |
| Immigrants | Haiti | 0.0 /100 | #307 | Tragic 96.3% |
| Immigrants | Laos | 0.0 /100 | #308 | Tragic 96.3% |
| Immigrants | Guyana | 0.0 /100 | #309 | Tragic 96.3% |