New Zealander vs Immigrants from Norway 9th Grade
COMPARE
New Zealander
Immigrants from Norway
9th Grade
9th Grade Comparison
New Zealanders
Immigrants from Norway
95.9%
9TH GRADE
99.8/ 100
METRIC RATING
59th/ 347
METRIC RANK
95.5%
9TH GRADE
97.1/ 100
METRIC RATING
106th/ 347
METRIC RANK
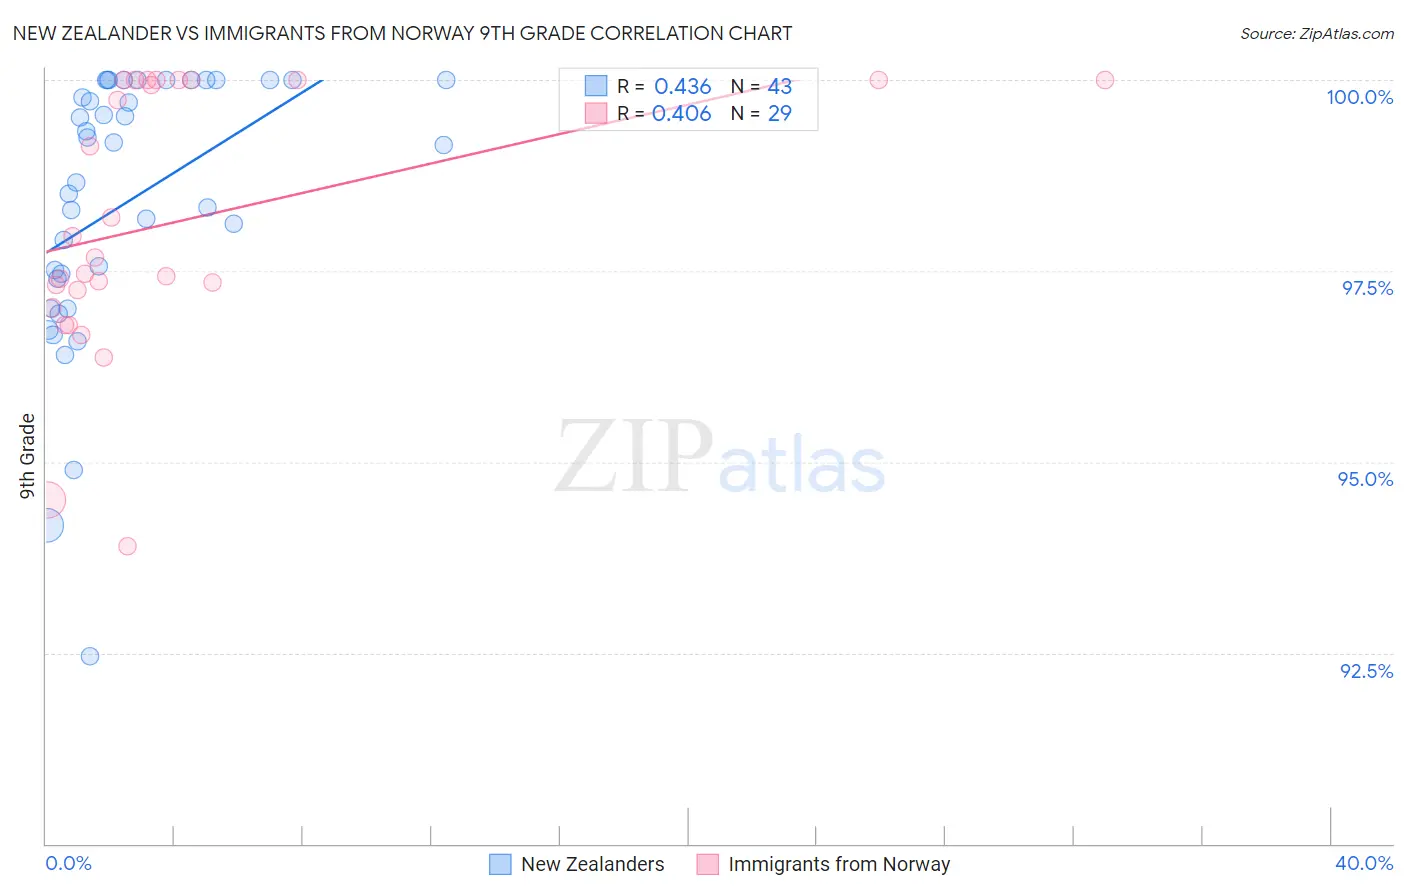
New Zealander vs Immigrants from Norway 9th Grade Correlation Chart
The statistical analysis conducted on geographies consisting of 106,912,053 people shows a moderate positive correlation between the proportion of New Zealanders and percentage of population with at least 9th grade education in the United States with a correlation coefficient (R) of 0.436 and weighted average of 95.9%. Similarly, the statistical analysis conducted on geographies consisting of 116,716,420 people shows a moderate positive correlation between the proportion of Immigrants from Norway and percentage of population with at least 9th grade education in the United States with a correlation coefficient (R) of 0.406 and weighted average of 95.5%, a difference of 0.48%.
9th Grade Correlation Summary
| Measurement | New Zealander | Immigrants from Norway |
| Minimum | 92.5% | 93.9% |
| Maximum | 100.0% | 100.0% |
| Range | 7.5% | 6.1% |
| Mean | 98.4% | 98.1% |
| Median | 99.2% | 97.7% |
| Interquartile 25% (IQ1) | 97.4% | 97.1% |
| Interquartile 75% (IQ3) | 100.0% | 100.0% |
| Interquartile Range (IQR) | 2.6% | 2.9% |
| Standard Deviation (Sample) | 1.8% | 1.7% |
| Standard Deviation (Population) | 1.7% | 1.7% |
Similar Demographics by 9th Grade
Demographics Similar to New Zealanders by 9th Grade
In terms of 9th grade, the demographic groups most similar to New Zealanders are Macedonian (96.0%, a difference of 0.020%), Aleut (96.0%, a difference of 0.020%), Native Hawaiian (95.9%, a difference of 0.020%), Immigrants from Austria (96.0%, a difference of 0.030%), and Immigrants from North America (96.0%, a difference of 0.030%).
| Demographics | Rating | Rank | 9th Grade |
| Serbians | 99.9 /100 | #52 | Exceptional 96.0% |
| Austrians | 99.8 /100 | #53 | Exceptional 96.0% |
| Immigrants | Canada | 99.8 /100 | #54 | Exceptional 96.0% |
| Immigrants | Austria | 99.8 /100 | #55 | Exceptional 96.0% |
| Immigrants | North America | 99.8 /100 | #56 | Exceptional 96.0% |
| Macedonians | 99.8 /100 | #57 | Exceptional 96.0% |
| Aleuts | 99.8 /100 | #58 | Exceptional 96.0% |
| New Zealanders | 99.8 /100 | #59 | Exceptional 95.9% |
| Native Hawaiians | 99.8 /100 | #60 | Exceptional 95.9% |
| Sioux | 99.8 /100 | #61 | Exceptional 95.9% |
| Ukrainians | 99.7 /100 | #62 | Exceptional 95.9% |
| Canadians | 99.7 /100 | #63 | Exceptional 95.9% |
| Zimbabweans | 99.7 /100 | #64 | Exceptional 95.9% |
| Immigrants | England | 99.6 /100 | #65 | Exceptional 95.9% |
| Immigrants | Netherlands | 99.6 /100 | #66 | Exceptional 95.8% |
Demographics Similar to Immigrants from Norway by 9th Grade
In terms of 9th grade, the demographic groups most similar to Immigrants from Norway are Immigrants from France (95.5%, a difference of 0.010%), Syrian (95.5%, a difference of 0.020%), Immigrants from Zimbabwe (95.5%, a difference of 0.020%), Chickasaw (95.5%, a difference of 0.020%), and Osage (95.5%, a difference of 0.020%).
| Demographics | Rating | Rank | 9th Grade |
| Menominee | 98.3 /100 | #99 | Exceptional 95.6% |
| Lebanese | 98.1 /100 | #100 | Exceptional 95.6% |
| Immigrants | Moldova | 97.9 /100 | #101 | Exceptional 95.5% |
| Immigrants | Switzerland | 97.7 /100 | #102 | Exceptional 95.5% |
| Potawatomi | 97.7 /100 | #103 | Exceptional 95.5% |
| Syrians | 97.4 /100 | #104 | Exceptional 95.5% |
| Immigrants | France | 97.4 /100 | #105 | Exceptional 95.5% |
| Immigrants | Norway | 97.1 /100 | #106 | Exceptional 95.5% |
| Immigrants | Zimbabwe | 96.9 /100 | #107 | Exceptional 95.5% |
| Chickasaw | 96.8 /100 | #108 | Exceptional 95.5% |
| Osage | 96.8 /100 | #109 | Exceptional 95.5% |
| Immigrants | Bulgaria | 96.7 /100 | #110 | Exceptional 95.5% |
| Cherokee | 96.3 /100 | #111 | Exceptional 95.4% |
| Immigrants | Croatia | 96.2 /100 | #112 | Exceptional 95.4% |
| Iroquois | 96.2 /100 | #113 | Exceptional 95.4% |