New Zealander vs Latvian 9th Grade
COMPARE
New Zealander
Latvian
9th Grade
9th Grade Comparison
New Zealanders
Latvians
95.9%
9TH GRADE
99.8/ 100
METRIC RATING
59th/ 347
METRIC RANK
96.4%
9TH GRADE
100.0/ 100
METRIC RATING
24th/ 347
METRIC RANK
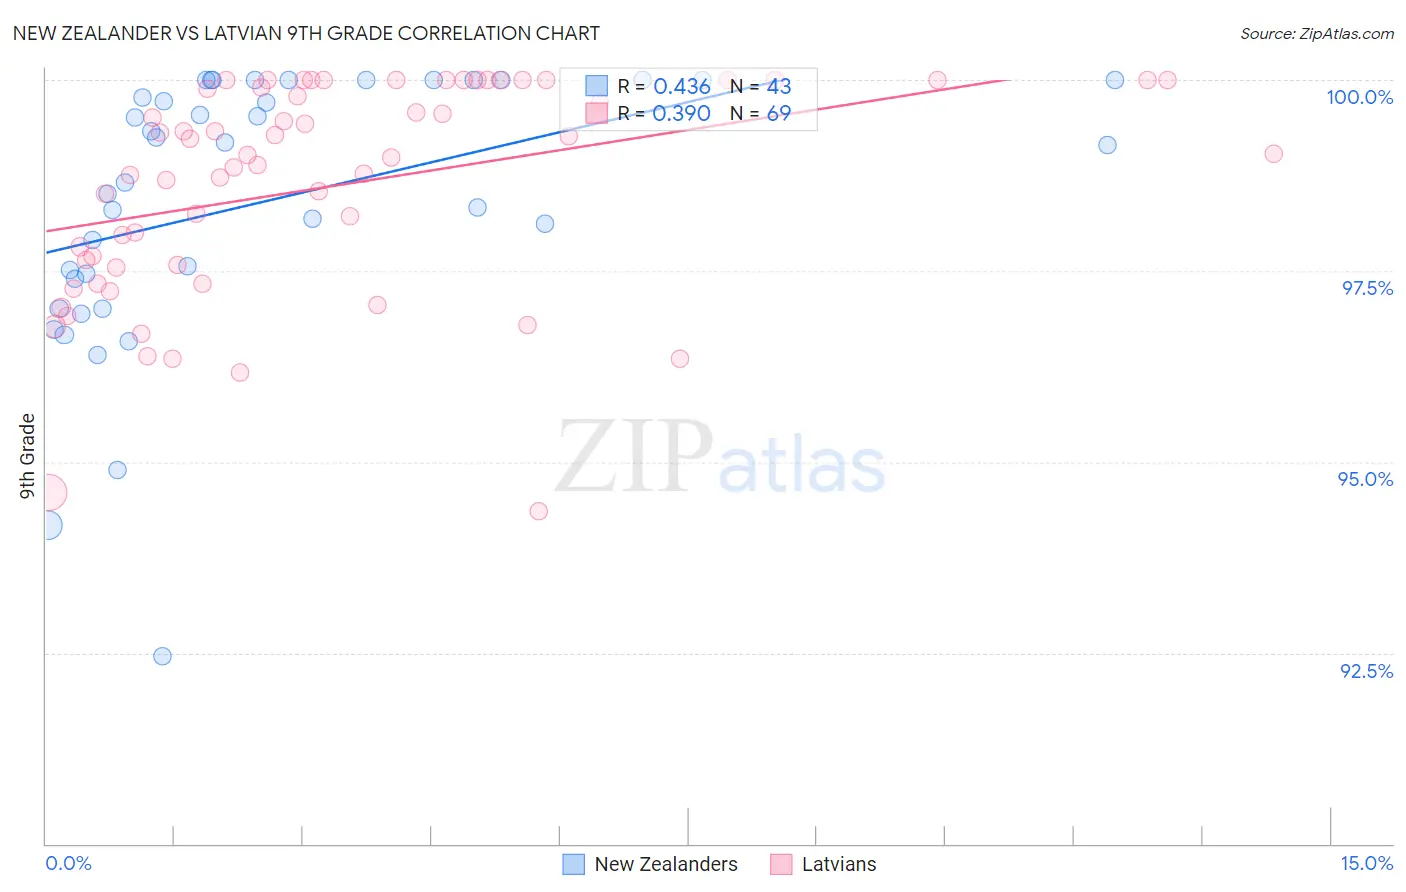
New Zealander vs Latvian 9th Grade Correlation Chart
The statistical analysis conducted on geographies consisting of 106,912,053 people shows a moderate positive correlation between the proportion of New Zealanders and percentage of population with at least 9th grade education in the United States with a correlation coefficient (R) of 0.436 and weighted average of 95.9%. Similarly, the statistical analysis conducted on geographies consisting of 220,726,265 people shows a mild positive correlation between the proportion of Latvians and percentage of population with at least 9th grade education in the United States with a correlation coefficient (R) of 0.390 and weighted average of 96.4%, a difference of 0.42%.
9th Grade Correlation Summary
| Measurement | New Zealander | Latvian |
| Minimum | 92.5% | 94.4% |
| Maximum | 100.0% | 100.0% |
| Range | 7.5% | 5.6% |
| Mean | 98.4% | 98.6% |
| Median | 99.2% | 99.0% |
| Interquartile 25% (IQ1) | 97.4% | 97.6% |
| Interquartile 75% (IQ3) | 100.0% | 100.0% |
| Interquartile Range (IQR) | 2.6% | 2.4% |
| Standard Deviation (Sample) | 1.8% | 1.4% |
| Standard Deviation (Population) | 1.7% | 1.4% |
Similar Demographics by 9th Grade
Demographics Similar to New Zealanders by 9th Grade
In terms of 9th grade, the demographic groups most similar to New Zealanders are Macedonian (96.0%, a difference of 0.020%), Aleut (96.0%, a difference of 0.020%), Native Hawaiian (95.9%, a difference of 0.020%), Immigrants from Austria (96.0%, a difference of 0.030%), and Immigrants from North America (96.0%, a difference of 0.030%).
| Demographics | Rating | Rank | 9th Grade |
| Serbians | 99.9 /100 | #52 | Exceptional 96.0% |
| Austrians | 99.8 /100 | #53 | Exceptional 96.0% |
| Immigrants | Canada | 99.8 /100 | #54 | Exceptional 96.0% |
| Immigrants | Austria | 99.8 /100 | #55 | Exceptional 96.0% |
| Immigrants | North America | 99.8 /100 | #56 | Exceptional 96.0% |
| Macedonians | 99.8 /100 | #57 | Exceptional 96.0% |
| Aleuts | 99.8 /100 | #58 | Exceptional 96.0% |
| New Zealanders | 99.8 /100 | #59 | Exceptional 95.9% |
| Native Hawaiians | 99.8 /100 | #60 | Exceptional 95.9% |
| Sioux | 99.8 /100 | #61 | Exceptional 95.9% |
| Ukrainians | 99.7 /100 | #62 | Exceptional 95.9% |
| Canadians | 99.7 /100 | #63 | Exceptional 95.9% |
| Zimbabweans | 99.7 /100 | #64 | Exceptional 95.9% |
| Immigrants | England | 99.6 /100 | #65 | Exceptional 95.9% |
| Immigrants | Netherlands | 99.6 /100 | #66 | Exceptional 95.8% |
Demographics Similar to Latvians by 9th Grade
In terms of 9th grade, the demographic groups most similar to Latvians are French (96.3%, a difference of 0.010%), Czech (96.4%, a difference of 0.030%), European (96.4%, a difference of 0.040%), French Canadian (96.3%, a difference of 0.040%), and Alaskan Athabascan (96.4%, a difference of 0.050%).
| Demographics | Rating | Rank | 9th Grade |
| Dutch | 100.0 /100 | #17 | Exceptional 96.5% |
| Scandinavians | 100.0 /100 | #18 | Exceptional 96.5% |
| Welsh | 100.0 /100 | #19 | Exceptional 96.4% |
| Italians | 100.0 /100 | #20 | Exceptional 96.4% |
| Alaskan Athabascans | 100.0 /100 | #21 | Exceptional 96.4% |
| Europeans | 100.0 /100 | #22 | Exceptional 96.4% |
| Czechs | 100.0 /100 | #23 | Exceptional 96.4% |
| Latvians | 100.0 /100 | #24 | Exceptional 96.4% |
| French | 100.0 /100 | #25 | Exceptional 96.3% |
| French Canadians | 100.0 /100 | #26 | Exceptional 96.3% |
| Scotch-Irish | 100.0 /100 | #27 | Exceptional 96.3% |
| Eastern Europeans | 100.0 /100 | #28 | Exceptional 96.3% |
| Chinese | 100.0 /100 | #29 | Exceptional 96.3% |
| Maltese | 100.0 /100 | #30 | Exceptional 96.3% |
| British | 100.0 /100 | #31 | Exceptional 96.3% |