Moroccan vs Immigrants from Norway 9th Grade
COMPARE
Moroccan
Immigrants from Norway
9th Grade
9th Grade Comparison
Moroccans
Immigrants from Norway
94.6%
9TH GRADE
19.6/ 100
METRIC RATING
204th/ 347
METRIC RANK
95.5%
9TH GRADE
97.1/ 100
METRIC RATING
106th/ 347
METRIC RANK
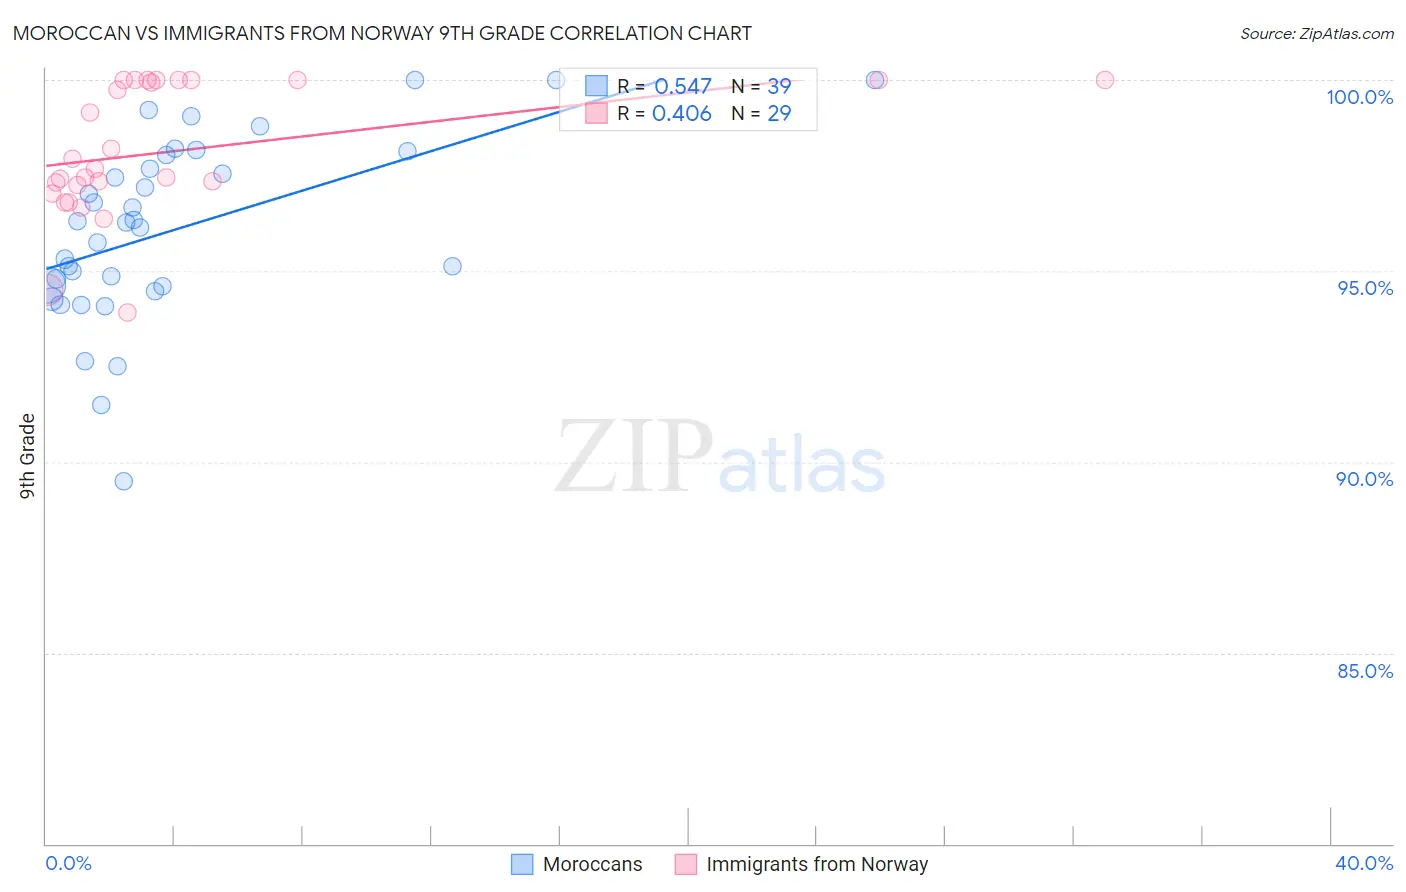
Moroccan vs Immigrants from Norway 9th Grade Correlation Chart
The statistical analysis conducted on geographies consisting of 201,817,667 people shows a substantial positive correlation between the proportion of Moroccans and percentage of population with at least 9th grade education in the United States with a correlation coefficient (R) of 0.547 and weighted average of 94.6%. Similarly, the statistical analysis conducted on geographies consisting of 116,716,420 people shows a moderate positive correlation between the proportion of Immigrants from Norway and percentage of population with at least 9th grade education in the United States with a correlation coefficient (R) of 0.406 and weighted average of 95.5%, a difference of 0.91%.
9th Grade Correlation Summary
| Measurement | Moroccan | Immigrants from Norway |
| Minimum | 89.5% | 93.9% |
| Maximum | 100.0% | 100.0% |
| Range | 10.5% | 6.1% |
| Mean | 96.1% | 98.1% |
| Median | 96.3% | 97.7% |
| Interquartile 25% (IQ1) | 94.6% | 97.1% |
| Interquartile 75% (IQ3) | 98.0% | 100.0% |
| Interquartile Range (IQR) | 3.4% | 2.9% |
| Standard Deviation (Sample) | 2.4% | 1.7% |
| Standard Deviation (Population) | 2.4% | 1.7% |
Similar Demographics by 9th Grade
Demographics Similar to Moroccans by 9th Grade
In terms of 9th grade, the demographic groups most similar to Moroccans are Immigrants from Eastern Asia (94.6%, a difference of 0.0%), Immigrants from Bahamas (94.6%, a difference of 0.0%), Immigrants from Zaire (94.6%, a difference of 0.010%), Black/African American (94.6%, a difference of 0.010%), and Laotian (94.6%, a difference of 0.020%).
| Demographics | Rating | Rank | 9th Grade |
| Immigrants | Micronesia | 24.7 /100 | #197 | Fair 94.7% |
| Hawaiians | 22.7 /100 | #198 | Fair 94.7% |
| Laotians | 21.0 /100 | #199 | Fair 94.6% |
| Immigrants | Zaire | 20.6 /100 | #200 | Fair 94.6% |
| Blacks/African Americans | 20.5 /100 | #201 | Fair 94.6% |
| Immigrants | Eastern Asia | 19.8 /100 | #202 | Poor 94.6% |
| Immigrants | Bahamas | 19.8 /100 | #203 | Poor 94.6% |
| Moroccans | 19.6 /100 | #204 | Poor 94.6% |
| Immigrants | Sudan | 17.6 /100 | #205 | Poor 94.6% |
| Samoans | 17.3 /100 | #206 | Poor 94.6% |
| Immigrants | Morocco | 16.3 /100 | #207 | Poor 94.6% |
| Immigrants | Pakistan | 15.5 /100 | #208 | Poor 94.6% |
| Comanche | 14.9 /100 | #209 | Poor 94.6% |
| Immigrants | Chile | 13.4 /100 | #210 | Poor 94.5% |
| Immigrants | Indonesia | 12.3 /100 | #211 | Poor 94.5% |
Demographics Similar to Immigrants from Norway by 9th Grade
In terms of 9th grade, the demographic groups most similar to Immigrants from Norway are Immigrants from France (95.5%, a difference of 0.010%), Syrian (95.5%, a difference of 0.020%), Immigrants from Zimbabwe (95.5%, a difference of 0.020%), Chickasaw (95.5%, a difference of 0.020%), and Osage (95.5%, a difference of 0.020%).
| Demographics | Rating | Rank | 9th Grade |
| Menominee | 98.3 /100 | #99 | Exceptional 95.6% |
| Lebanese | 98.1 /100 | #100 | Exceptional 95.6% |
| Immigrants | Moldova | 97.9 /100 | #101 | Exceptional 95.5% |
| Immigrants | Switzerland | 97.7 /100 | #102 | Exceptional 95.5% |
| Potawatomi | 97.7 /100 | #103 | Exceptional 95.5% |
| Syrians | 97.4 /100 | #104 | Exceptional 95.5% |
| Immigrants | France | 97.4 /100 | #105 | Exceptional 95.5% |
| Immigrants | Norway | 97.1 /100 | #106 | Exceptional 95.5% |
| Immigrants | Zimbabwe | 96.9 /100 | #107 | Exceptional 95.5% |
| Chickasaw | 96.8 /100 | #108 | Exceptional 95.5% |
| Osage | 96.8 /100 | #109 | Exceptional 95.5% |
| Immigrants | Bulgaria | 96.7 /100 | #110 | Exceptional 95.5% |
| Cherokee | 96.3 /100 | #111 | Exceptional 95.4% |
| Immigrants | Croatia | 96.2 /100 | #112 | Exceptional 95.4% |
| Iroquois | 96.2 /100 | #113 | Exceptional 95.4% |