Maltese vs Immigrants from Norway 9th Grade
COMPARE
Maltese
Immigrants from Norway
9th Grade
9th Grade Comparison
Maltese
Immigrants from Norway
96.3%
9TH GRADE
100.0/ 100
METRIC RATING
30th/ 347
METRIC RANK
95.5%
9TH GRADE
97.1/ 100
METRIC RATING
106th/ 347
METRIC RANK
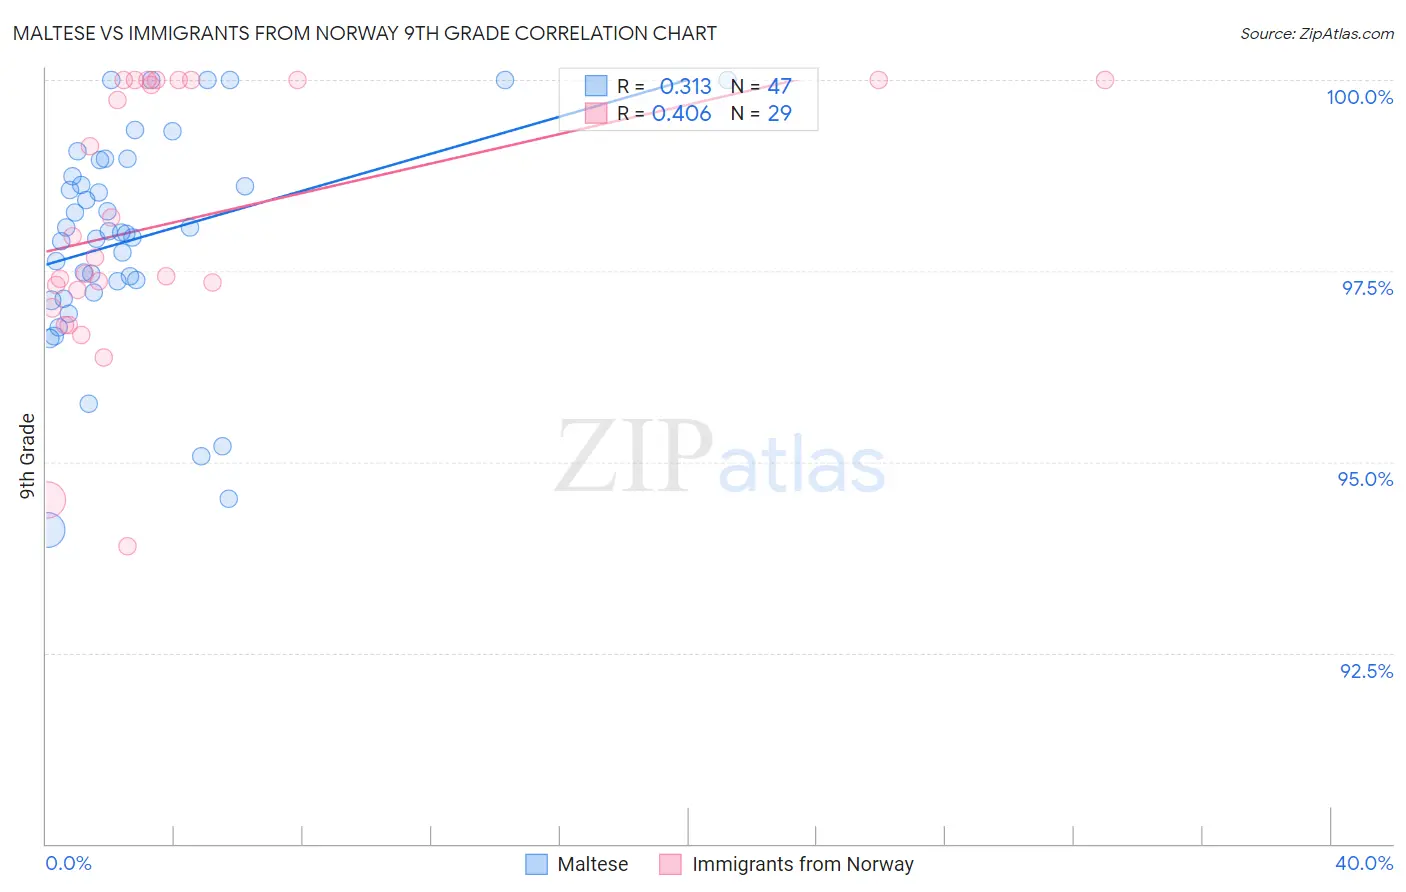
Maltese vs Immigrants from Norway 9th Grade Correlation Chart
The statistical analysis conducted on geographies consisting of 126,476,608 people shows a mild positive correlation between the proportion of Maltese and percentage of population with at least 9th grade education in the United States with a correlation coefficient (R) of 0.313 and weighted average of 96.3%. Similarly, the statistical analysis conducted on geographies consisting of 116,716,420 people shows a moderate positive correlation between the proportion of Immigrants from Norway and percentage of population with at least 9th grade education in the United States with a correlation coefficient (R) of 0.406 and weighted average of 95.5%, a difference of 0.82%.
9th Grade Correlation Summary
| Measurement | Maltese | Immigrants from Norway |
| Minimum | 94.1% | 93.9% |
| Maximum | 100.0% | 100.0% |
| Range | 5.9% | 6.1% |
| Mean | 97.9% | 98.1% |
| Median | 98.0% | 97.7% |
| Interquartile 25% (IQ1) | 97.2% | 97.1% |
| Interquartile 75% (IQ3) | 99.0% | 100.0% |
| Interquartile Range (IQR) | 1.7% | 2.9% |
| Standard Deviation (Sample) | 1.4% | 1.7% |
| Standard Deviation (Population) | 1.4% | 1.7% |
Similar Demographics by 9th Grade
Demographics Similar to Maltese by 9th Grade
In terms of 9th grade, the demographic groups most similar to Maltese are British (96.3%, a difference of 0.0%), Belgian (96.3%, a difference of 0.010%), Chinese (96.3%, a difference of 0.020%), Luxembourger (96.3%, a difference of 0.020%), and Scotch-Irish (96.3%, a difference of 0.030%).
| Demographics | Rating | Rank | 9th Grade |
| Czechs | 100.0 /100 | #23 | Exceptional 96.4% |
| Latvians | 100.0 /100 | #24 | Exceptional 96.4% |
| French | 100.0 /100 | #25 | Exceptional 96.3% |
| French Canadians | 100.0 /100 | #26 | Exceptional 96.3% |
| Scotch-Irish | 100.0 /100 | #27 | Exceptional 96.3% |
| Eastern Europeans | 100.0 /100 | #28 | Exceptional 96.3% |
| Chinese | 100.0 /100 | #29 | Exceptional 96.3% |
| Maltese | 100.0 /100 | #30 | Exceptional 96.3% |
| British | 100.0 /100 | #31 | Exceptional 96.3% |
| Belgians | 100.0 /100 | #32 | Exceptional 96.3% |
| Luxembourgers | 100.0 /100 | #33 | Exceptional 96.3% |
| Hungarians | 100.0 /100 | #34 | Exceptional 96.2% |
| Bulgarians | 99.9 /100 | #35 | Exceptional 96.2% |
| Northern Europeans | 99.9 /100 | #36 | Exceptional 96.2% |
| Estonians | 99.9 /100 | #37 | Exceptional 96.1% |
Demographics Similar to Immigrants from Norway by 9th Grade
In terms of 9th grade, the demographic groups most similar to Immigrants from Norway are Immigrants from France (95.5%, a difference of 0.010%), Syrian (95.5%, a difference of 0.020%), Immigrants from Zimbabwe (95.5%, a difference of 0.020%), Chickasaw (95.5%, a difference of 0.020%), and Osage (95.5%, a difference of 0.020%).
| Demographics | Rating | Rank | 9th Grade |
| Menominee | 98.3 /100 | #99 | Exceptional 95.6% |
| Lebanese | 98.1 /100 | #100 | Exceptional 95.6% |
| Immigrants | Moldova | 97.9 /100 | #101 | Exceptional 95.5% |
| Immigrants | Switzerland | 97.7 /100 | #102 | Exceptional 95.5% |
| Potawatomi | 97.7 /100 | #103 | Exceptional 95.5% |
| Syrians | 97.4 /100 | #104 | Exceptional 95.5% |
| Immigrants | France | 97.4 /100 | #105 | Exceptional 95.5% |
| Immigrants | Norway | 97.1 /100 | #106 | Exceptional 95.5% |
| Immigrants | Zimbabwe | 96.9 /100 | #107 | Exceptional 95.5% |
| Chickasaw | 96.8 /100 | #108 | Exceptional 95.5% |
| Osage | 96.8 /100 | #109 | Exceptional 95.5% |
| Immigrants | Bulgaria | 96.7 /100 | #110 | Exceptional 95.5% |
| Cherokee | 96.3 /100 | #111 | Exceptional 95.4% |
| Immigrants | Croatia | 96.2 /100 | #112 | Exceptional 95.4% |
| Iroquois | 96.2 /100 | #113 | Exceptional 95.4% |