New Zealander vs Immigrants from Western Asia 9th Grade
COMPARE
New Zealander
Immigrants from Western Asia
9th Grade
9th Grade Comparison
New Zealanders
Immigrants from Western Asia
95.9%
9TH GRADE
99.8/ 100
METRIC RATING
59th/ 347
METRIC RANK
94.5%
9TH GRADE
10.7/ 100
METRIC RATING
216th/ 347
METRIC RANK
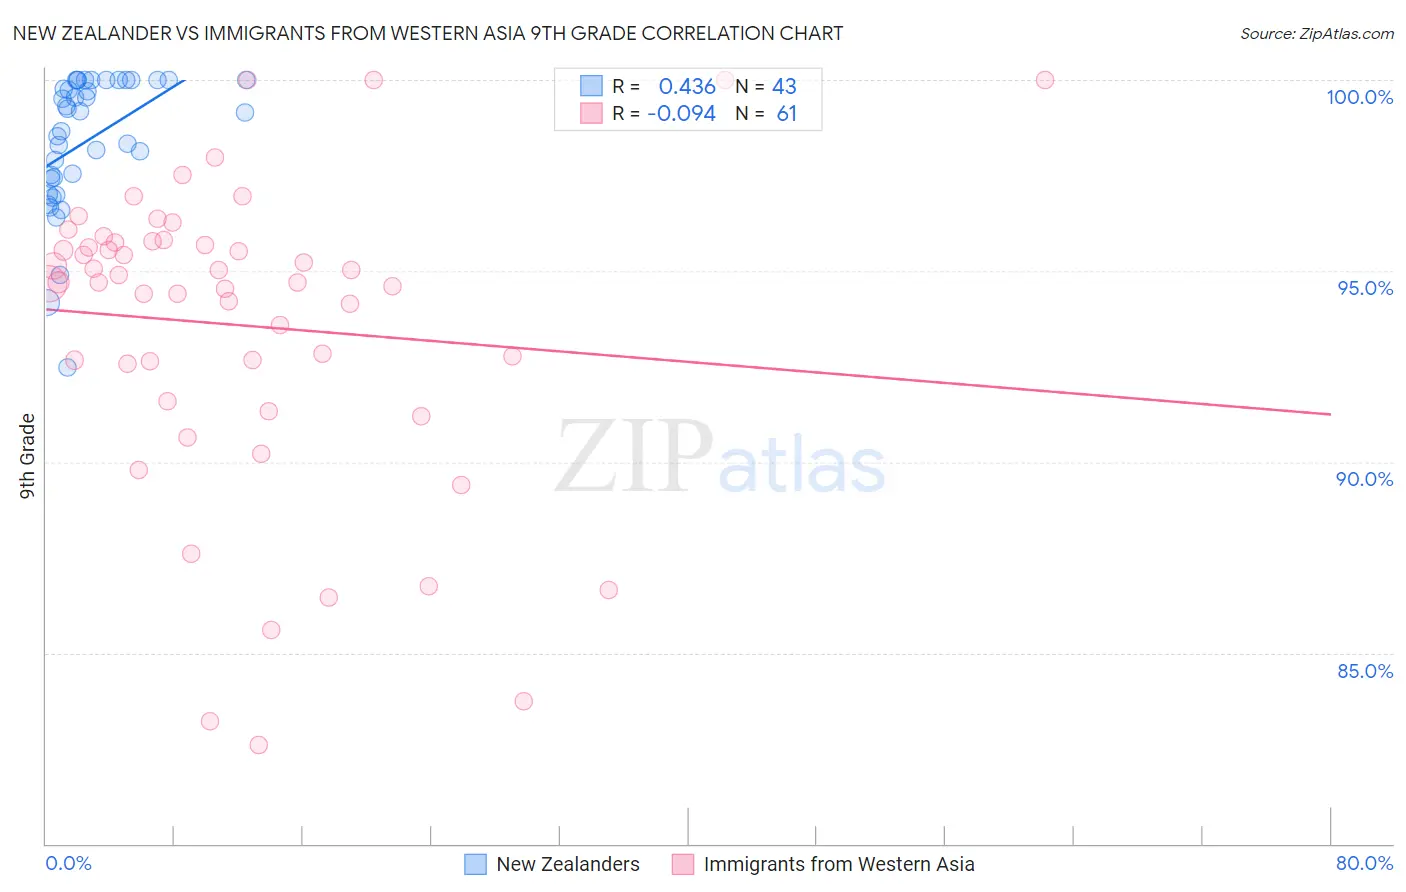
New Zealander vs Immigrants from Western Asia 9th Grade Correlation Chart
The statistical analysis conducted on geographies consisting of 106,912,053 people shows a moderate positive correlation between the proportion of New Zealanders and percentage of population with at least 9th grade education in the United States with a correlation coefficient (R) of 0.436 and weighted average of 95.9%. Similarly, the statistical analysis conducted on geographies consisting of 404,433,811 people shows a slight negative correlation between the proportion of Immigrants from Western Asia and percentage of population with at least 9th grade education in the United States with a correlation coefficient (R) of -0.094 and weighted average of 94.5%, a difference of 1.5%.
9th Grade Correlation Summary
| Measurement | New Zealander | Immigrants from Western Asia |
| Minimum | 92.5% | 82.6% |
| Maximum | 100.0% | 100.0% |
| Range | 7.5% | 17.4% |
| Mean | 98.4% | 93.6% |
| Median | 99.2% | 94.7% |
| Interquartile 25% (IQ1) | 97.4% | 92.1% |
| Interquartile 75% (IQ3) | 100.0% | 95.8% |
| Interquartile Range (IQR) | 2.6% | 3.7% |
| Standard Deviation (Sample) | 1.8% | 4.0% |
| Standard Deviation (Population) | 1.7% | 4.0% |
Similar Demographics by 9th Grade
Demographics Similar to New Zealanders by 9th Grade
In terms of 9th grade, the demographic groups most similar to New Zealanders are Macedonian (96.0%, a difference of 0.020%), Aleut (96.0%, a difference of 0.020%), Native Hawaiian (95.9%, a difference of 0.020%), Immigrants from Austria (96.0%, a difference of 0.030%), and Immigrants from North America (96.0%, a difference of 0.030%).
| Demographics | Rating | Rank | 9th Grade |
| Serbians | 99.9 /100 | #52 | Exceptional 96.0% |
| Austrians | 99.8 /100 | #53 | Exceptional 96.0% |
| Immigrants | Canada | 99.8 /100 | #54 | Exceptional 96.0% |
| Immigrants | Austria | 99.8 /100 | #55 | Exceptional 96.0% |
| Immigrants | North America | 99.8 /100 | #56 | Exceptional 96.0% |
| Macedonians | 99.8 /100 | #57 | Exceptional 96.0% |
| Aleuts | 99.8 /100 | #58 | Exceptional 96.0% |
| New Zealanders | 99.8 /100 | #59 | Exceptional 95.9% |
| Native Hawaiians | 99.8 /100 | #60 | Exceptional 95.9% |
| Sioux | 99.8 /100 | #61 | Exceptional 95.9% |
| Ukrainians | 99.7 /100 | #62 | Exceptional 95.9% |
| Canadians | 99.7 /100 | #63 | Exceptional 95.9% |
| Zimbabweans | 99.7 /100 | #64 | Exceptional 95.9% |
| Immigrants | England | 99.6 /100 | #65 | Exceptional 95.9% |
| Immigrants | Netherlands | 99.6 /100 | #66 | Exceptional 95.8% |
Demographics Similar to Immigrants from Western Asia by 9th Grade
In terms of 9th grade, the demographic groups most similar to Immigrants from Western Asia are Immigrants from Syria (94.5%, a difference of 0.010%), Immigrants from Liberia (94.5%, a difference of 0.020%), Asian (94.5%, a difference of 0.020%), Immigrants from Indonesia (94.5%, a difference of 0.030%), and Immigrants from Malaysia (94.5%, a difference of 0.030%).
| Demographics | Rating | Rank | 9th Grade |
| Comanche | 14.9 /100 | #209 | Poor 94.6% |
| Immigrants | Chile | 13.4 /100 | #210 | Poor 94.5% |
| Immigrants | Indonesia | 12.3 /100 | #211 | Poor 94.5% |
| Immigrants | Malaysia | 12.2 /100 | #212 | Poor 94.5% |
| Immigrants | Oceania | 12.1 /100 | #213 | Poor 94.5% |
| Immigrants | Liberia | 11.8 /100 | #214 | Poor 94.5% |
| Immigrants | Syria | 11.0 /100 | #215 | Poor 94.5% |
| Immigrants | Western Asia | 10.7 /100 | #216 | Poor 94.5% |
| Asians | 9.9 /100 | #217 | Tragic 94.5% |
| Portuguese | 9.2 /100 | #218 | Tragic 94.5% |
| Africans | 9.0 /100 | #219 | Tragic 94.5% |
| Indians (Asian) | 8.6 /100 | #220 | Tragic 94.5% |
| Immigrants | Eastern Africa | 8.2 /100 | #221 | Tragic 94.5% |
| Immigrants | Asia | 7.7 /100 | #222 | Tragic 94.4% |
| Bahamians | 7.0 /100 | #223 | Tragic 94.4% |