Belizean vs Immigrants from Norway 9th Grade
COMPARE
Belizean
Immigrants from Norway
9th Grade
9th Grade Comparison
Belizeans
Immigrants from Norway
91.8%
9TH GRADE
0.0/ 100
METRIC RATING
322nd/ 347
METRIC RANK
95.5%
9TH GRADE
97.1/ 100
METRIC RATING
106th/ 347
METRIC RANK
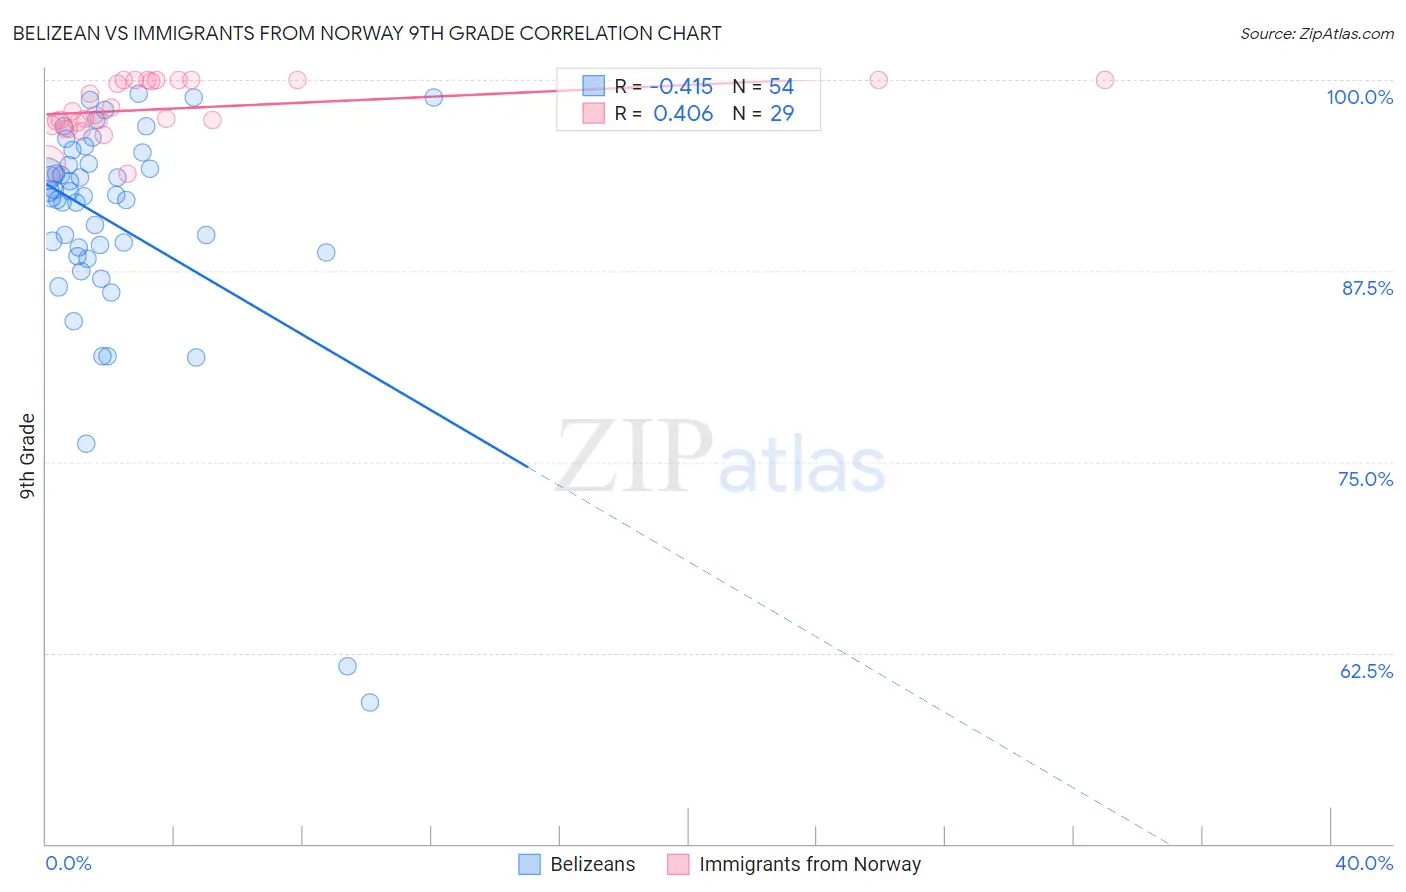
Belizean vs Immigrants from Norway 9th Grade Correlation Chart
The statistical analysis conducted on geographies consisting of 144,225,006 people shows a moderate negative correlation between the proportion of Belizeans and percentage of population with at least 9th grade education in the United States with a correlation coefficient (R) of -0.415 and weighted average of 91.8%. Similarly, the statistical analysis conducted on geographies consisting of 116,716,420 people shows a moderate positive correlation between the proportion of Immigrants from Norway and percentage of population with at least 9th grade education in the United States with a correlation coefficient (R) of 0.406 and weighted average of 95.5%, a difference of 4.0%.
9th Grade Correlation Summary
| Measurement | Belizean | Immigrants from Norway |
| Minimum | 59.3% | 93.9% |
| Maximum | 99.1% | 100.0% |
| Range | 39.8% | 6.1% |
| Mean | 90.6% | 98.1% |
| Median | 92.4% | 97.7% |
| Interquartile 25% (IQ1) | 88.7% | 97.1% |
| Interquartile 75% (IQ3) | 94.5% | 100.0% |
| Interquartile Range (IQR) | 5.9% | 2.9% |
| Standard Deviation (Sample) | 7.7% | 1.7% |
| Standard Deviation (Population) | 7.6% | 1.7% |
Similar Demographics by 9th Grade
Demographics Similar to Belizeans by 9th Grade
In terms of 9th grade, the demographic groups most similar to Belizeans are Puerto Rican (91.8%, a difference of 0.0%), Immigrants from Ecuador (91.8%, a difference of 0.030%), Immigrants from Belize (91.8%, a difference of 0.060%), Nicaraguan (91.9%, a difference of 0.090%), and Ecuadorian (91.9%, a difference of 0.13%).
| Demographics | Rating | Rank | 9th Grade |
| Immigrants | Caribbean | 0.0 /100 | #315 | Tragic 92.2% |
| Cape Verdeans | 0.0 /100 | #316 | Tragic 92.2% |
| Immigrants | Cuba | 0.0 /100 | #317 | Tragic 92.2% |
| Nepalese | 0.0 /100 | #318 | Tragic 92.0% |
| Ecuadorians | 0.0 /100 | #319 | Tragic 91.9% |
| Nicaraguans | 0.0 /100 | #320 | Tragic 91.9% |
| Immigrants | Ecuador | 0.0 /100 | #321 | Tragic 91.8% |
| Belizeans | 0.0 /100 | #322 | Tragic 91.8% |
| Puerto Ricans | 0.0 /100 | #323 | Tragic 91.8% |
| Immigrants | Belize | 0.0 /100 | #324 | Tragic 91.8% |
| Central American Indians | 0.0 /100 | #325 | Tragic 91.5% |
| Immigrants | Armenia | 0.0 /100 | #326 | Tragic 91.4% |
| Immigrants | Nicaragua | 0.0 /100 | #327 | Tragic 91.3% |
| Dominicans | 0.0 /100 | #328 | Tragic 91.1% |
| Hondurans | 0.0 /100 | #329 | Tragic 91.0% |
Demographics Similar to Immigrants from Norway by 9th Grade
In terms of 9th grade, the demographic groups most similar to Immigrants from Norway are Immigrants from France (95.5%, a difference of 0.010%), Syrian (95.5%, a difference of 0.020%), Immigrants from Zimbabwe (95.5%, a difference of 0.020%), Chickasaw (95.5%, a difference of 0.020%), and Osage (95.5%, a difference of 0.020%).
| Demographics | Rating | Rank | 9th Grade |
| Menominee | 98.3 /100 | #99 | Exceptional 95.6% |
| Lebanese | 98.1 /100 | #100 | Exceptional 95.6% |
| Immigrants | Moldova | 97.9 /100 | #101 | Exceptional 95.5% |
| Immigrants | Switzerland | 97.7 /100 | #102 | Exceptional 95.5% |
| Potawatomi | 97.7 /100 | #103 | Exceptional 95.5% |
| Syrians | 97.4 /100 | #104 | Exceptional 95.5% |
| Immigrants | France | 97.4 /100 | #105 | Exceptional 95.5% |
| Immigrants | Norway | 97.1 /100 | #106 | Exceptional 95.5% |
| Immigrants | Zimbabwe | 96.9 /100 | #107 | Exceptional 95.5% |
| Chickasaw | 96.8 /100 | #108 | Exceptional 95.5% |
| Osage | 96.8 /100 | #109 | Exceptional 95.5% |
| Immigrants | Bulgaria | 96.7 /100 | #110 | Exceptional 95.5% |
| Cherokee | 96.3 /100 | #111 | Exceptional 95.4% |
| Immigrants | Croatia | 96.2 /100 | #112 | Exceptional 95.4% |
| Iroquois | 96.2 /100 | #113 | Exceptional 95.4% |