New Zealander vs Northern European 9th Grade
COMPARE
New Zealander
Northern European
9th Grade
9th Grade Comparison
New Zealanders
Northern Europeans
95.9%
9TH GRADE
99.8/ 100
METRIC RATING
59th/ 347
METRIC RANK
96.2%
9TH GRADE
99.9/ 100
METRIC RATING
36th/ 347
METRIC RANK
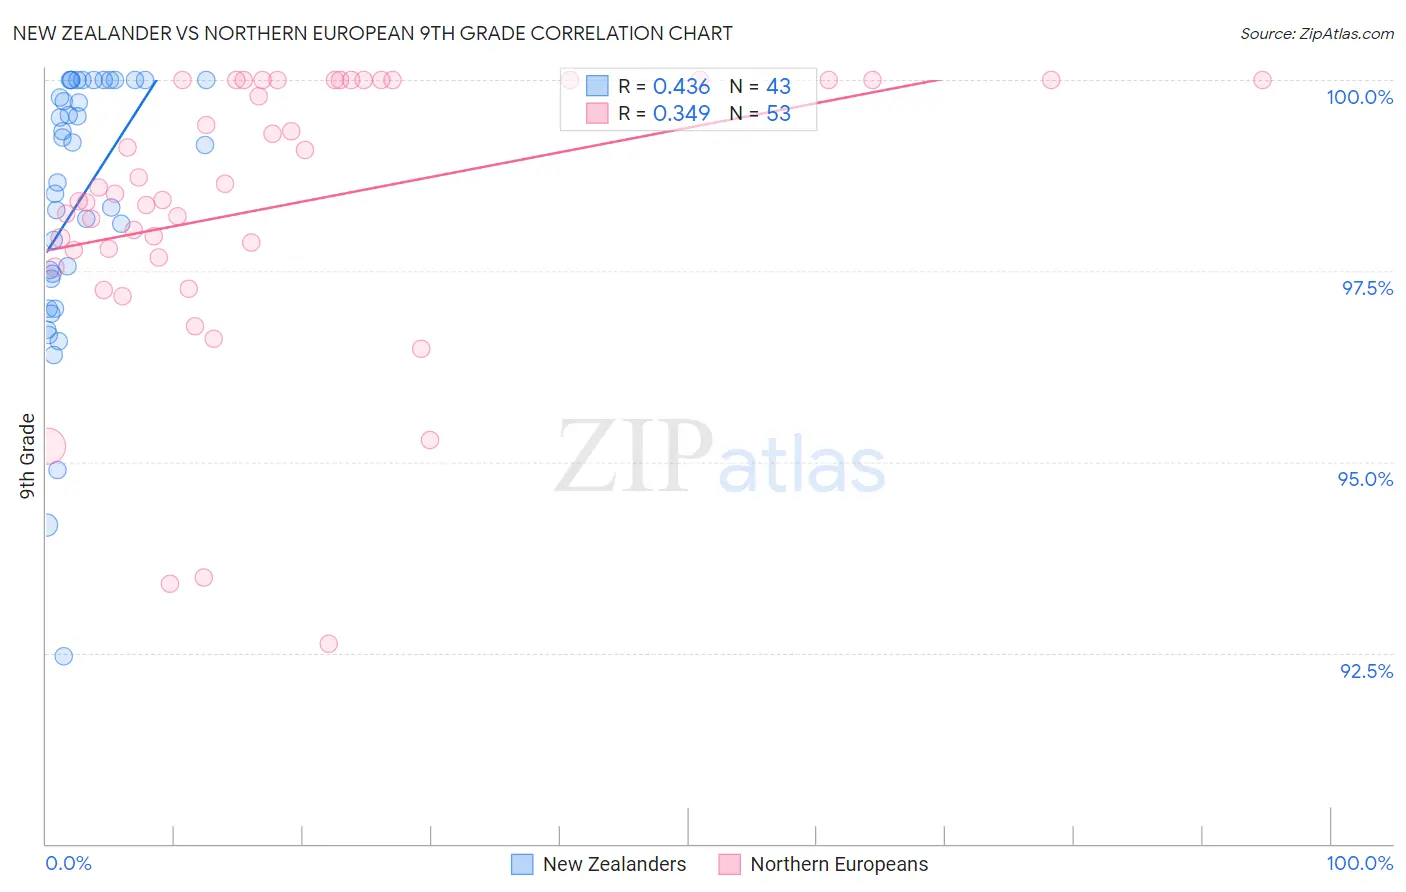
New Zealander vs Northern European 9th Grade Correlation Chart
The statistical analysis conducted on geographies consisting of 106,912,053 people shows a moderate positive correlation between the proportion of New Zealanders and percentage of population with at least 9th grade education in the United States with a correlation coefficient (R) of 0.436 and weighted average of 95.9%. Similarly, the statistical analysis conducted on geographies consisting of 406,096,351 people shows a mild positive correlation between the proportion of Northern Europeans and percentage of population with at least 9th grade education in the United States with a correlation coefficient (R) of 0.349 and weighted average of 96.2%, a difference of 0.25%.
9th Grade Correlation Summary
| Measurement | New Zealander | Northern European |
| Minimum | 92.5% | 92.6% |
| Maximum | 100.0% | 100.0% |
| Range | 7.5% | 7.4% |
| Mean | 98.4% | 98.4% |
| Median | 99.2% | 98.5% |
| Interquartile 25% (IQ1) | 97.4% | 97.7% |
| Interquartile 75% (IQ3) | 100.0% | 100.0% |
| Interquartile Range (IQR) | 2.6% | 2.3% |
| Standard Deviation (Sample) | 1.8% | 1.8% |
| Standard Deviation (Population) | 1.7% | 1.8% |
Similar Demographics by 9th Grade
Demographics Similar to New Zealanders by 9th Grade
In terms of 9th grade, the demographic groups most similar to New Zealanders are Macedonian (96.0%, a difference of 0.020%), Aleut (96.0%, a difference of 0.020%), Native Hawaiian (95.9%, a difference of 0.020%), Immigrants from Austria (96.0%, a difference of 0.030%), and Immigrants from North America (96.0%, a difference of 0.030%).
| Demographics | Rating | Rank | 9th Grade |
| Serbians | 99.9 /100 | #52 | Exceptional 96.0% |
| Austrians | 99.8 /100 | #53 | Exceptional 96.0% |
| Immigrants | Canada | 99.8 /100 | #54 | Exceptional 96.0% |
| Immigrants | Austria | 99.8 /100 | #55 | Exceptional 96.0% |
| Immigrants | North America | 99.8 /100 | #56 | Exceptional 96.0% |
| Macedonians | 99.8 /100 | #57 | Exceptional 96.0% |
| Aleuts | 99.8 /100 | #58 | Exceptional 96.0% |
| New Zealanders | 99.8 /100 | #59 | Exceptional 95.9% |
| Native Hawaiians | 99.8 /100 | #60 | Exceptional 95.9% |
| Sioux | 99.8 /100 | #61 | Exceptional 95.9% |
| Ukrainians | 99.7 /100 | #62 | Exceptional 95.9% |
| Canadians | 99.7 /100 | #63 | Exceptional 95.9% |
| Zimbabweans | 99.7 /100 | #64 | Exceptional 95.9% |
| Immigrants | England | 99.6 /100 | #65 | Exceptional 95.9% |
| Immigrants | Netherlands | 99.6 /100 | #66 | Exceptional 95.8% |
Demographics Similar to Northern Europeans by 9th Grade
In terms of 9th grade, the demographic groups most similar to Northern Europeans are Bulgarian (96.2%, a difference of 0.010%), Hungarian (96.2%, a difference of 0.040%), Estonian (96.1%, a difference of 0.040%), Immigrants from Scotland (96.1%, a difference of 0.040%), and Ottawa (96.1%, a difference of 0.060%).
| Demographics | Rating | Rank | 9th Grade |
| Chinese | 100.0 /100 | #29 | Exceptional 96.3% |
| Maltese | 100.0 /100 | #30 | Exceptional 96.3% |
| British | 100.0 /100 | #31 | Exceptional 96.3% |
| Belgians | 100.0 /100 | #32 | Exceptional 96.3% |
| Luxembourgers | 100.0 /100 | #33 | Exceptional 96.3% |
| Hungarians | 100.0 /100 | #34 | Exceptional 96.2% |
| Bulgarians | 99.9 /100 | #35 | Exceptional 96.2% |
| Northern Europeans | 99.9 /100 | #36 | Exceptional 96.2% |
| Estonians | 99.9 /100 | #37 | Exceptional 96.1% |
| Immigrants | Scotland | 99.9 /100 | #38 | Exceptional 96.1% |
| Ottawa | 99.9 /100 | #39 | Exceptional 96.1% |
| Slavs | 99.9 /100 | #40 | Exceptional 96.1% |
| Czechoslovakians | 99.9 /100 | #41 | Exceptional 96.1% |
| Chippewa | 99.9 /100 | #42 | Exceptional 96.1% |
| Iranians | 99.9 /100 | #43 | Exceptional 96.1% |