Nepalese vs Palestinian No Schooling Completed
COMPARE
Nepalese
Palestinian
No Schooling Completed
No Schooling Completed Comparison
Nepalese
Palestinians
3.8%
NO SCHOOLING COMPLETED
0.0/ 100
METRIC RATING
344th/ 347
METRIC RANK
1.9%
NO SCHOOLING COMPLETED
91.8/ 100
METRIC RATING
130th/ 347
METRIC RANK
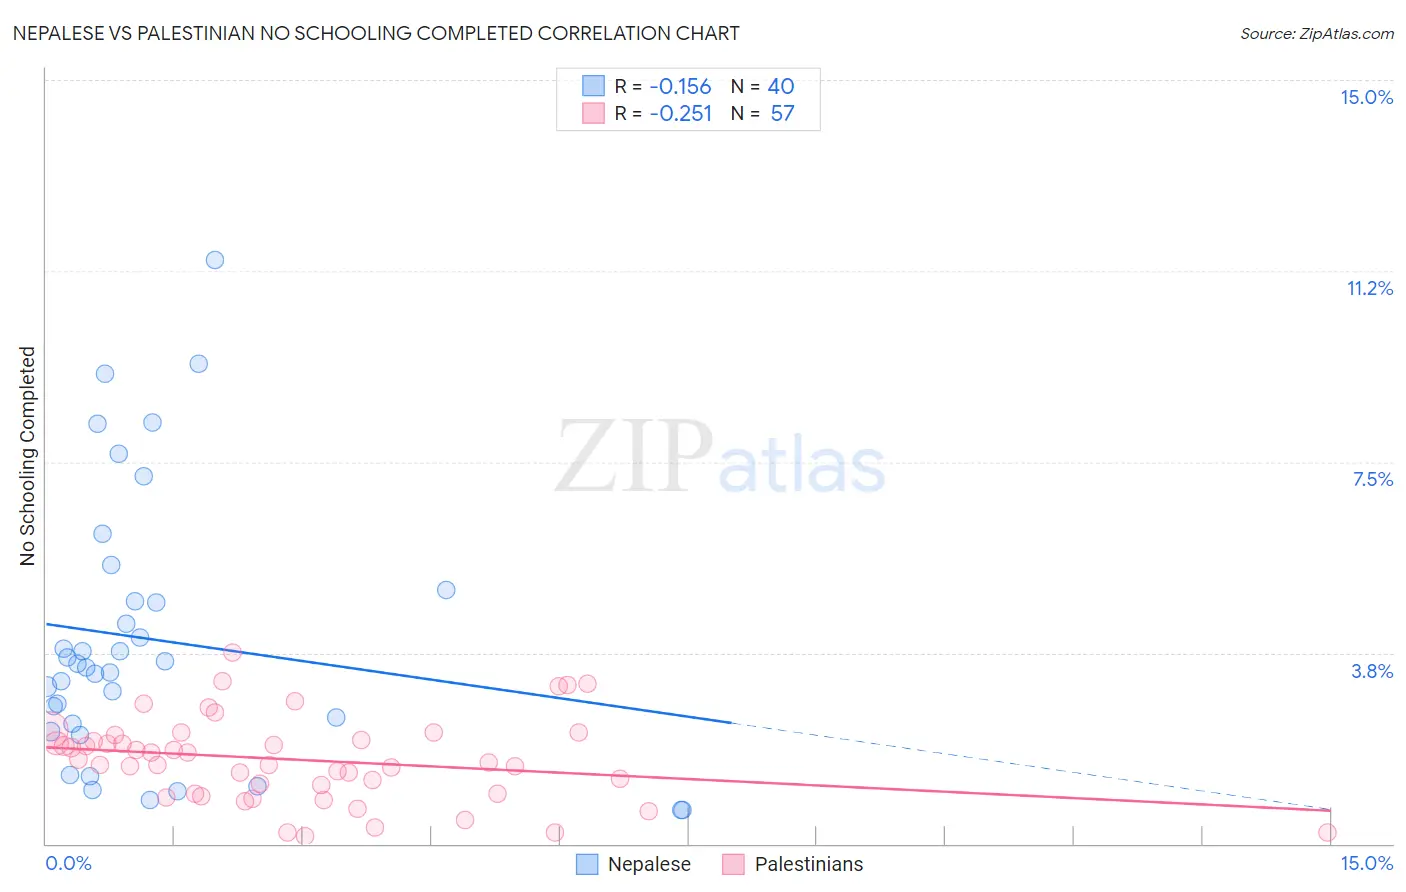
Nepalese vs Palestinian No Schooling Completed Correlation Chart
The statistical analysis conducted on geographies consisting of 24,510,165 people shows a poor negative correlation between the proportion of Nepalese and percentage of population with no schooling in the United States with a correlation coefficient (R) of -0.156 and weighted average of 3.8%. Similarly, the statistical analysis conducted on geographies consisting of 215,613,106 people shows a weak negative correlation between the proportion of Palestinians and percentage of population with no schooling in the United States with a correlation coefficient (R) of -0.251 and weighted average of 1.9%, a difference of 98.1%.
No Schooling Completed Correlation Summary
| Measurement | Nepalese | Palestinian |
| Minimum | 0.66% | 0.16% |
| Maximum | 11.5% | 3.8% |
| Range | 10.8% | 3.6% |
| Mean | 4.0% | 1.6% |
| Median | 3.5% | 1.6% |
| Interquartile 25% (IQ1) | 2.3% | 0.98% |
| Interquartile 75% (IQ3) | 4.9% | 2.1% |
| Interquartile Range (IQR) | 2.6% | 1.1% |
| Standard Deviation (Sample) | 2.6% | 0.83% |
| Standard Deviation (Population) | 2.6% | 0.82% |
Similar Demographics by No Schooling Completed
Demographics Similar to Nepalese by No Schooling Completed
In terms of no schooling completed, the demographic groups most similar to Nepalese are Salvadoran (3.7%, a difference of 1.7%), Immigrants from El Salvador (3.9%, a difference of 1.8%), Immigrants from Mexico (3.6%, a difference of 4.5%), Immigrants from Central America (3.6%, a difference of 5.3%), and Immigrants from Guatemala (3.6%, a difference of 6.4%).
| Demographics | Rating | Rank | No Schooling Completed |
| Immigrants | Dominican Republic | 0.0 /100 | #333 | Tragic 3.4% |
| Guatemalans | 0.0 /100 | #334 | Tragic 3.5% |
| Immigrants | Cambodia | 0.0 /100 | #335 | Tragic 3.5% |
| Immigrants | Fiji | 0.0 /100 | #336 | Tragic 3.5% |
| Immigrants | Cabo Verde | 0.0 /100 | #337 | Tragic 3.5% |
| Bangladeshis | 0.0 /100 | #338 | Tragic 3.5% |
| Yakama | 0.0 /100 | #339 | Tragic 3.6% |
| Immigrants | Guatemala | 0.0 /100 | #340 | Tragic 3.6% |
| Immigrants | Central America | 0.0 /100 | #341 | Tragic 3.6% |
| Immigrants | Mexico | 0.0 /100 | #342 | Tragic 3.6% |
| Salvadorans | 0.0 /100 | #343 | Tragic 3.7% |
| Nepalese | 0.0 /100 | #344 | Tragic 3.8% |
| Immigrants | El Salvador | 0.0 /100 | #345 | Tragic 3.9% |
| Immigrants | Yemen | 0.0 /100 | #346 | Tragic 4.1% |
| Spanish American Indians | 0.0 /100 | #347 | Tragic 4.2% |
Demographics Similar to Palestinians by No Schooling Completed
In terms of no schooling completed, the demographic groups most similar to Palestinians are Seminole (1.9%, a difference of 0.11%), Immigrants from Hungary (1.9%, a difference of 0.11%), Spaniard (1.9%, a difference of 0.25%), Israeli (1.9%, a difference of 0.33%), and Immigrants from Romania (1.9%, a difference of 0.40%).
| Demographics | Rating | Rank | No Schooling Completed |
| Immigrants | Kuwait | 93.9 /100 | #123 | Exceptional 1.9% |
| Cambodians | 93.8 /100 | #124 | Exceptional 1.9% |
| Immigrants | Europe | 93.7 /100 | #125 | Exceptional 1.9% |
| Immigrants | Romania | 92.6 /100 | #126 | Exceptional 1.9% |
| Israelis | 92.4 /100 | #127 | Exceptional 1.9% |
| Spaniards | 92.3 /100 | #128 | Exceptional 1.9% |
| Seminole | 92.0 /100 | #129 | Exceptional 1.9% |
| Palestinians | 91.8 /100 | #130 | Exceptional 1.9% |
| Immigrants | Hungary | 91.6 /100 | #131 | Exceptional 1.9% |
| Colville | 90.4 /100 | #132 | Exceptional 1.9% |
| Immigrants | Turkey | 90.2 /100 | #133 | Exceptional 1.9% |
| Menominee | 89.6 /100 | #134 | Excellent 1.9% |
| Hmong | 88.5 /100 | #135 | Excellent 1.9% |
| Burmese | 88.2 /100 | #136 | Excellent 1.9% |
| Filipinos | 85.5 /100 | #137 | Excellent 2.0% |