Soviet Union vs Israeli Doctorate Degree
COMPARE
Soviet Union
Israeli
Doctorate Degree
Doctorate Degree Comparison
Soviet Union
Israelis
2.5%
DOCTORATE DEGREE
100.0/ 100
METRIC RATING
43rd/ 347
METRIC RANK
2.7%
DOCTORATE DEGREE
100.0/ 100
METRIC RATING
24th/ 347
METRIC RANK
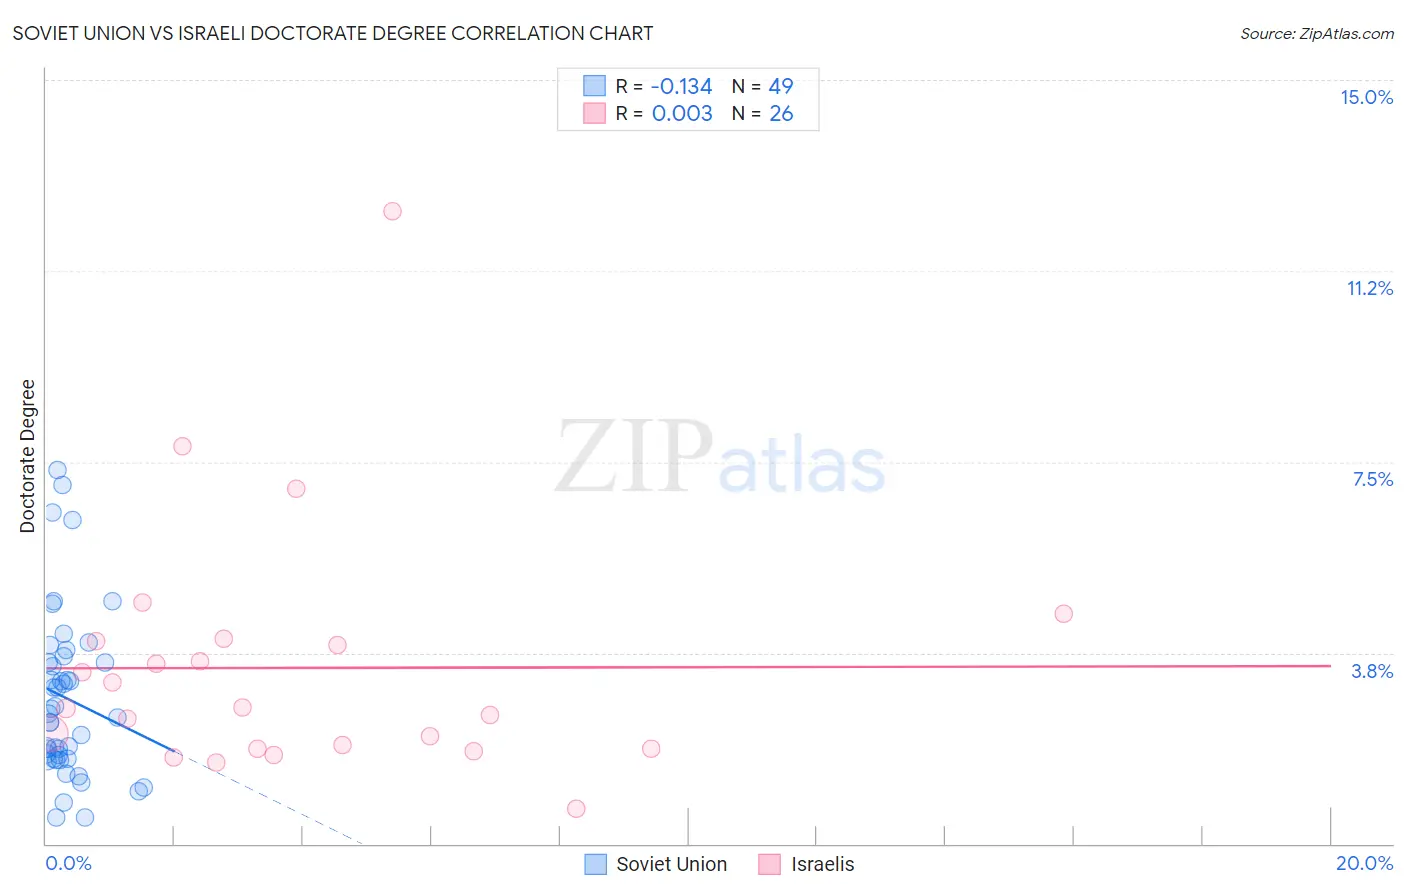
Soviet Union vs Israeli Doctorate Degree Correlation Chart
The statistical analysis conducted on geographies consisting of 43,500,474 people shows a poor negative correlation between the proportion of Soviet Union and percentage of population with at least doctorate degree education in the United States with a correlation coefficient (R) of -0.134 and weighted average of 2.5%. Similarly, the statistical analysis conducted on geographies consisting of 210,422,088 people shows no correlation between the proportion of Israelis and percentage of population with at least doctorate degree education in the United States with a correlation coefficient (R) of 0.003 and weighted average of 2.7%, a difference of 9.7%.
Doctorate Degree Correlation Summary
| Measurement | Soviet Union | Israeli |
| Minimum | 0.52% | 0.70% |
| Maximum | 7.3% | 12.4% |
| Range | 6.8% | 11.7% |
| Mean | 2.9% | 3.5% |
| Median | 2.5% | 2.7% |
| Interquartile 25% (IQ1) | 1.7% | 1.9% |
| Interquartile 75% (IQ3) | 3.6% | 4.0% |
| Interquartile Range (IQR) | 2.0% | 2.1% |
| Standard Deviation (Sample) | 1.6% | 2.4% |
| Standard Deviation (Population) | 1.6% | 2.4% |
Demographics Similar to Soviet Union and Israelis by Doctorate Degree
In terms of doctorate degree, the demographic groups most similar to Soviet Union are New Zealander (2.5%, a difference of 0.94%), Immigrants from Russia (2.5%, a difference of 1.6%), Estonian (2.5%, a difference of 1.9%), Immigrants from Ireland (2.5%, a difference of 2.3%), and Russian (2.6%, a difference of 2.8%). Similarly, the demographic groups most similar to Israelis are Immigrants from Denmark (2.8%, a difference of 1.3%), Immigrants from Saudi Arabia (2.7%, a difference of 1.5%), Turkish (2.7%, a difference of 2.0%), Immigrants from Turkey (2.6%, a difference of 2.9%), and Burmese (2.6%, a difference of 3.2%).
| Demographics | Rating | Rank | Doctorate Degree |
| Immigrants | Denmark | 100.0 /100 | #23 | Exceptional 2.8% |
| Israelis | 100.0 /100 | #24 | Exceptional 2.7% |
| Immigrants | Saudi Arabia | 100.0 /100 | #25 | Exceptional 2.7% |
| Turks | 100.0 /100 | #26 | Exceptional 2.7% |
| Immigrants | Turkey | 100.0 /100 | #27 | Exceptional 2.6% |
| Burmese | 100.0 /100 | #28 | Exceptional 2.6% |
| Immigrants | South Central Asia | 100.0 /100 | #29 | Exceptional 2.6% |
| Immigrants | Korea | 100.0 /100 | #30 | Exceptional 2.6% |
| Latvians | 100.0 /100 | #31 | Exceptional 2.6% |
| Immigrants | Northern Europe | 100.0 /100 | #32 | Exceptional 2.6% |
| Cambodians | 100.0 /100 | #33 | Exceptional 2.6% |
| Cypriots | 100.0 /100 | #34 | Exceptional 2.6% |
| Immigrants | Malaysia | 100.0 /100 | #35 | Exceptional 2.6% |
| Immigrants | Spain | 100.0 /100 | #36 | Exceptional 2.6% |
| Immigrants | Kuwait | 100.0 /100 | #37 | Exceptional 2.6% |
| Russians | 100.0 /100 | #38 | Exceptional 2.6% |
| Immigrants | Ireland | 100.0 /100 | #39 | Exceptional 2.5% |
| Estonians | 100.0 /100 | #40 | Exceptional 2.5% |
| Immigrants | Russia | 100.0 /100 | #41 | Exceptional 2.5% |
| New Zealanders | 100.0 /100 | #42 | Exceptional 2.5% |
| Soviet Union | 100.0 /100 | #43 | Exceptional 2.5% |