Nepalese vs Immigrants from Congo 5th Grade
COMPARE
Nepalese
Immigrants from Congo
5th Grade
5th Grade Comparison
Nepalese
Immigrants from Congo
95.2%
5TH GRADE
0.0/ 100
METRIC RATING
334th/ 347
METRIC RANK
96.8%
5TH GRADE
0.7/ 100
METRIC RATING
256th/ 347
METRIC RANK
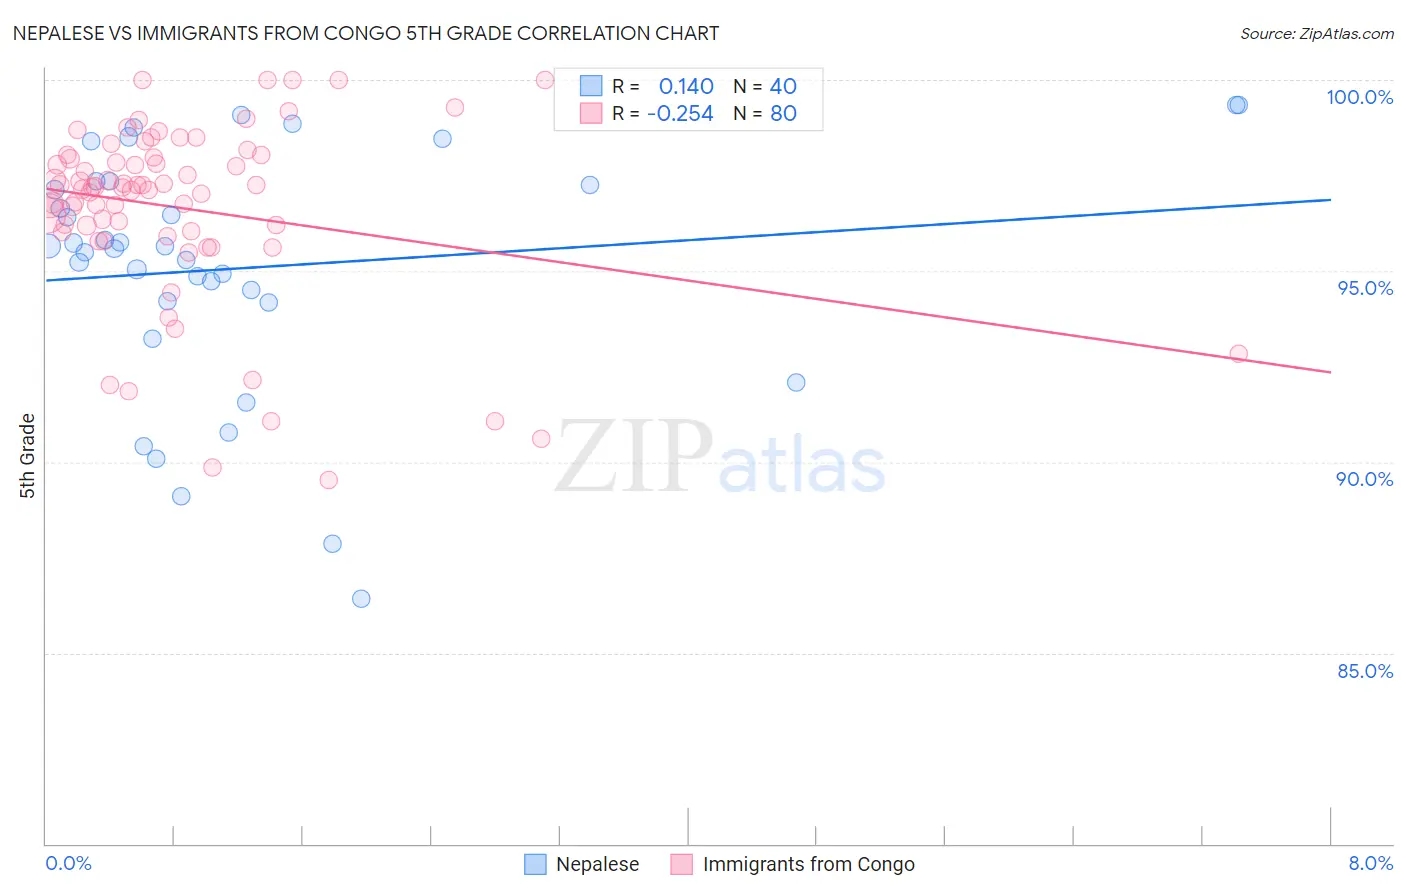
Nepalese vs Immigrants from Congo 5th Grade Correlation Chart
The statistical analysis conducted on geographies consisting of 24,521,755 people shows a poor positive correlation between the proportion of Nepalese and percentage of population with at least 5th grade education in the United States with a correlation coefficient (R) of 0.140 and weighted average of 95.2%. Similarly, the statistical analysis conducted on geographies consisting of 92,124,753 people shows a weak negative correlation between the proportion of Immigrants from Congo and percentage of population with at least 5th grade education in the United States with a correlation coefficient (R) of -0.254 and weighted average of 96.8%, a difference of 1.7%.
5th Grade Correlation Summary
| Measurement | Nepalese | Immigrants from Congo |
| Minimum | 86.4% | 89.5% |
| Maximum | 99.3% | 100.0% |
| Range | 12.9% | 10.5% |
| Mean | 95.1% | 96.6% |
| Median | 95.6% | 97.2% |
| Interquartile 25% (IQ1) | 94.2% | 96.0% |
| Interquartile 75% (IQ3) | 97.3% | 98.0% |
| Interquartile Range (IQR) | 3.1% | 2.0% |
| Standard Deviation (Sample) | 3.2% | 2.4% |
| Standard Deviation (Population) | 3.2% | 2.3% |
Similar Demographics by 5th Grade
Demographics Similar to Nepalese by 5th Grade
In terms of 5th grade, the demographic groups most similar to Nepalese are Immigrants from Dominican Republic (95.3%, a difference of 0.030%), Immigrants from Latin America (95.3%, a difference of 0.030%), Mexican (95.2%, a difference of 0.030%), Immigrants from the Azores (95.1%, a difference of 0.13%), and Immigrants from Honduras (95.4%, a difference of 0.14%).
| Demographics | Rating | Rank | 5th Grade |
| Dominicans | 0.0 /100 | #327 | Tragic 95.5% |
| Cape Verdeans | 0.0 /100 | #328 | Tragic 95.5% |
| Mexican American Indians | 0.0 /100 | #329 | Tragic 95.5% |
| Immigrants | Armenia | 0.0 /100 | #330 | Tragic 95.4% |
| Immigrants | Honduras | 0.0 /100 | #331 | Tragic 95.4% |
| Immigrants | Dominican Republic | 0.0 /100 | #332 | Tragic 95.3% |
| Immigrants | Latin America | 0.0 /100 | #333 | Tragic 95.3% |
| Nepalese | 0.0 /100 | #334 | Tragic 95.2% |
| Mexicans | 0.0 /100 | #335 | Tragic 95.2% |
| Immigrants | Azores | 0.0 /100 | #336 | Tragic 95.1% |
| Central Americans | 0.0 /100 | #337 | Tragic 95.1% |
| Immigrants | Cabo Verde | 0.0 /100 | #338 | Tragic 94.9% |
| Immigrants | Yemen | 0.0 /100 | #339 | Tragic 94.9% |
| Guatemalans | 0.0 /100 | #340 | Tragic 94.8% |
| Yakama | 0.0 /100 | #341 | Tragic 94.8% |
Demographics Similar to Immigrants from Congo by 5th Grade
In terms of 5th grade, the demographic groups most similar to Immigrants from Congo are South American (96.8%, a difference of 0.0%), Peruvian (96.8%, a difference of 0.0%), Immigrants from Senegal (96.8%, a difference of 0.020%), Immigrants from Middle Africa (96.8%, a difference of 0.030%), and Immigrants from Ethiopia (96.8%, a difference of 0.030%).
| Demographics | Rating | Rank | 5th Grade |
| Immigrants | Uruguay | 1.0 /100 | #249 | Tragic 96.9% |
| Immigrants | Liberia | 1.0 /100 | #250 | Tragic 96.9% |
| Bolivians | 0.9 /100 | #251 | Tragic 96.9% |
| Jamaicans | 0.9 /100 | #252 | Tragic 96.9% |
| Immigrants | Middle Africa | 0.8 /100 | #253 | Tragic 96.8% |
| Immigrants | Senegal | 0.8 /100 | #254 | Tragic 96.8% |
| South Americans | 0.7 /100 | #255 | Tragic 96.8% |
| Immigrants | Congo | 0.7 /100 | #256 | Tragic 96.8% |
| Peruvians | 0.6 /100 | #257 | Tragic 96.8% |
| Immigrants | Ethiopia | 0.5 /100 | #258 | Tragic 96.8% |
| Immigrants | China | 0.5 /100 | #259 | Tragic 96.8% |
| Immigrants | Jamaica | 0.4 /100 | #260 | Tragic 96.8% |
| Immigrants | Sierra Leone | 0.4 /100 | #261 | Tragic 96.8% |
| Immigrants | Colombia | 0.4 /100 | #262 | Tragic 96.8% |
| Immigrants | Uzbekistan | 0.3 /100 | #263 | Tragic 96.8% |