Nepalese vs Bermudan 5th Grade
COMPARE
Nepalese
Bermudan
5th Grade
5th Grade Comparison
Nepalese
Bermudans
95.2%
5TH GRADE
0.0/ 100
METRIC RATING
334th/ 347
METRIC RANK
97.4%
5TH GRADE
58.8/ 100
METRIC RATING
164th/ 347
METRIC RANK
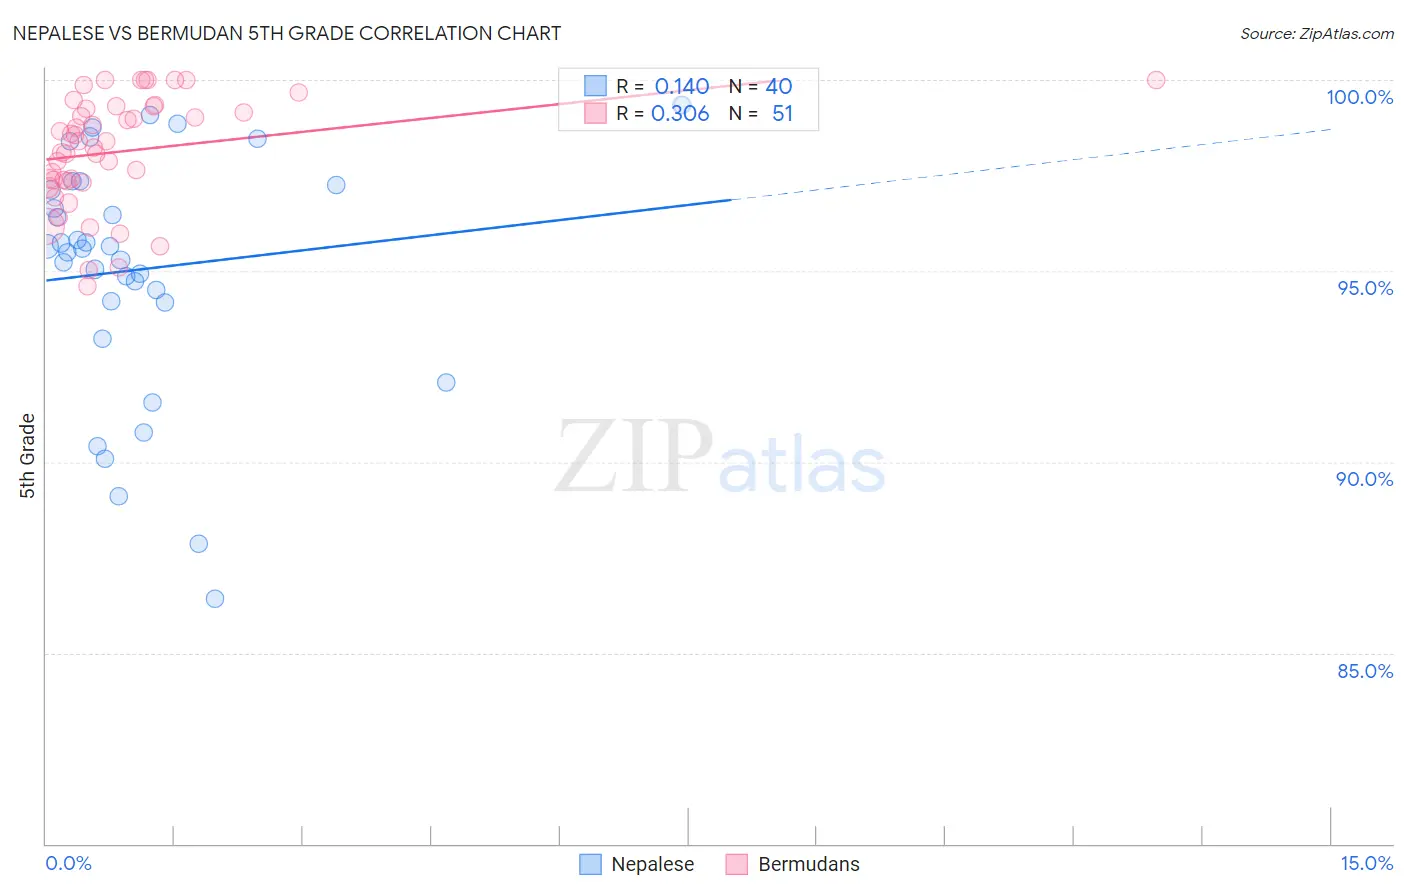
Nepalese vs Bermudan 5th Grade Correlation Chart
The statistical analysis conducted on geographies consisting of 24,521,755 people shows a poor positive correlation between the proportion of Nepalese and percentage of population with at least 5th grade education in the United States with a correlation coefficient (R) of 0.140 and weighted average of 95.2%. Similarly, the statistical analysis conducted on geographies consisting of 55,721,975 people shows a mild positive correlation between the proportion of Bermudans and percentage of population with at least 5th grade education in the United States with a correlation coefficient (R) of 0.306 and weighted average of 97.4%, a difference of 2.2%.
5th Grade Correlation Summary
| Measurement | Nepalese | Bermudan |
| Minimum | 86.4% | 94.6% |
| Maximum | 99.3% | 100.0% |
| Range | 12.9% | 5.4% |
| Mean | 95.1% | 98.1% |
| Median | 95.6% | 98.4% |
| Interquartile 25% (IQ1) | 94.2% | 97.3% |
| Interquartile 75% (IQ3) | 97.3% | 99.3% |
| Interquartile Range (IQR) | 3.1% | 2.0% |
| Standard Deviation (Sample) | 3.2% | 1.4% |
| Standard Deviation (Population) | 3.2% | 1.4% |
Similar Demographics by 5th Grade
Demographics Similar to Nepalese by 5th Grade
In terms of 5th grade, the demographic groups most similar to Nepalese are Immigrants from Dominican Republic (95.3%, a difference of 0.030%), Immigrants from Latin America (95.3%, a difference of 0.030%), Mexican (95.2%, a difference of 0.030%), Immigrants from the Azores (95.1%, a difference of 0.13%), and Immigrants from Honduras (95.4%, a difference of 0.14%).
| Demographics | Rating | Rank | 5th Grade |
| Dominicans | 0.0 /100 | #327 | Tragic 95.5% |
| Cape Verdeans | 0.0 /100 | #328 | Tragic 95.5% |
| Mexican American Indians | 0.0 /100 | #329 | Tragic 95.5% |
| Immigrants | Armenia | 0.0 /100 | #330 | Tragic 95.4% |
| Immigrants | Honduras | 0.0 /100 | #331 | Tragic 95.4% |
| Immigrants | Dominican Republic | 0.0 /100 | #332 | Tragic 95.3% |
| Immigrants | Latin America | 0.0 /100 | #333 | Tragic 95.3% |
| Nepalese | 0.0 /100 | #334 | Tragic 95.2% |
| Mexicans | 0.0 /100 | #335 | Tragic 95.2% |
| Immigrants | Azores | 0.0 /100 | #336 | Tragic 95.1% |
| Central Americans | 0.0 /100 | #337 | Tragic 95.1% |
| Immigrants | Cabo Verde | 0.0 /100 | #338 | Tragic 94.9% |
| Immigrants | Yemen | 0.0 /100 | #339 | Tragic 94.9% |
| Guatemalans | 0.0 /100 | #340 | Tragic 94.8% |
| Yakama | 0.0 /100 | #341 | Tragic 94.8% |
Demographics Similar to Bermudans by 5th Grade
In terms of 5th grade, the demographic groups most similar to Bermudans are Kenyan (97.4%, a difference of 0.0%), Immigrants from Iran (97.4%, a difference of 0.0%), Ugandan (97.4%, a difference of 0.0%), Immigrants from Poland (97.4%, a difference of 0.0%), and Marshallese (97.4%, a difference of 0.010%).
| Demographics | Rating | Rank | 5th Grade |
| Immigrants | Jordan | 70.4 /100 | #157 | Good 97.4% |
| Albanians | 68.3 /100 | #158 | Good 97.4% |
| Immigrants | Italy | 65.2 /100 | #159 | Good 97.4% |
| Marshallese | 61.2 /100 | #160 | Good 97.4% |
| Kenyans | 59.7 /100 | #161 | Average 97.4% |
| Immigrants | Iran | 59.5 /100 | #162 | Average 97.4% |
| Ugandans | 58.9 /100 | #163 | Average 97.4% |
| Bermudans | 58.8 /100 | #164 | Average 97.4% |
| Immigrants | Poland | 57.9 /100 | #165 | Average 97.4% |
| Apache | 57.2 /100 | #166 | Average 97.4% |
| Immigrants | Belarus | 54.6 /100 | #167 | Average 97.3% |
| Chileans | 54.5 /100 | #168 | Average 97.3% |
| Immigrants | Korea | 54.1 /100 | #169 | Average 97.3% |
| Venezuelans | 54.0 /100 | #170 | Average 97.3% |
| Immigrants | Sri Lanka | 53.8 /100 | #171 | Average 97.3% |