Immigrants from West Indies vs Serbian College, 1 year or more
COMPARE
Immigrants from West Indies
Serbian
College, 1 year or more
College, 1 year or more Comparison
Immigrants from West Indies
Serbians
55.2%
COLLEGE, 1 YEAR OR MORE
0.5/ 100
METRIC RATING
256th/ 347
METRIC RANK
61.4%
COLLEGE, 1 YEAR OR MORE
92.2/ 100
METRIC RATING
123rd/ 347
METRIC RANK
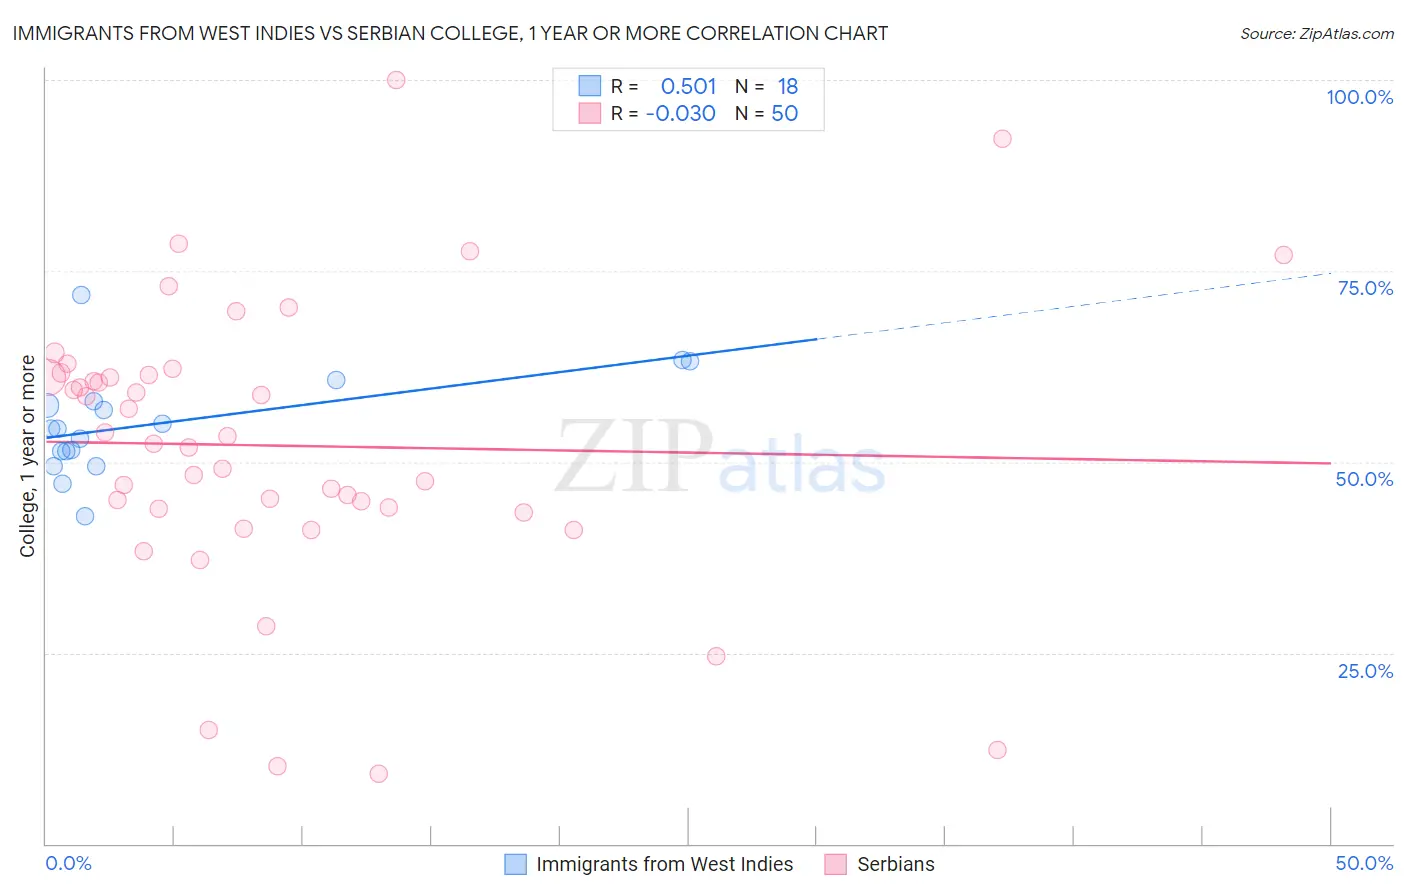
Immigrants from West Indies vs Serbian College, 1 year or more Correlation Chart
The statistical analysis conducted on geographies consisting of 72,420,477 people shows a substantial positive correlation between the proportion of Immigrants from West Indies and percentage of population with at least college, 1 year or more education in the United States with a correlation coefficient (R) of 0.501 and weighted average of 55.2%. Similarly, the statistical analysis conducted on geographies consisting of 267,640,905 people shows no correlation between the proportion of Serbians and percentage of population with at least college, 1 year or more education in the United States with a correlation coefficient (R) of -0.030 and weighted average of 61.4%, a difference of 11.2%.
College, 1 year or more Correlation Summary
| Measurement | Immigrants from West Indies | Serbian |
| Minimum | 42.9% | 9.2% |
| Maximum | 71.8% | 100.0% |
| Range | 28.9% | 90.8% |
| Mean | 55.1% | 52.1% |
| Median | 54.3% | 52.9% |
| Interquartile 25% (IQ1) | 51.4% | 43.9% |
| Interquartile 75% (IQ3) | 58.0% | 61.3% |
| Interquartile Range (IQR) | 6.6% | 17.4% |
| Standard Deviation (Sample) | 6.8% | 18.8% |
| Standard Deviation (Population) | 6.6% | 18.6% |
Similar Demographics by College, 1 year or more
Demographics Similar to Immigrants from West Indies by College, 1 year or more
In terms of college, 1 year or more, the demographic groups most similar to Immigrants from West Indies are Immigrants from Bahamas (55.2%, a difference of 0.080%), Indonesian (55.1%, a difference of 0.10%), Japanese (55.2%, a difference of 0.12%), Immigrants from Barbados (55.4%, a difference of 0.38%), and African (55.0%, a difference of 0.38%).
| Demographics | Rating | Rank | College, 1 year or more |
| Immigrants | Trinidad and Tobago | 0.7 /100 | #249 | Tragic 55.5% |
| Delaware | 0.7 /100 | #250 | Tragic 55.5% |
| Immigrants | Cambodia | 0.6 /100 | #251 | Tragic 55.4% |
| Aleuts | 0.6 /100 | #252 | Tragic 55.4% |
| Immigrants | Barbados | 0.6 /100 | #253 | Tragic 55.4% |
| Japanese | 0.5 /100 | #254 | Tragic 55.2% |
| Immigrants | Bahamas | 0.5 /100 | #255 | Tragic 55.2% |
| Immigrants | West Indies | 0.5 /100 | #256 | Tragic 55.2% |
| Indonesians | 0.4 /100 | #257 | Tragic 55.1% |
| Africans | 0.4 /100 | #258 | Tragic 55.0% |
| Nepalese | 0.3 /100 | #259 | Tragic 54.9% |
| Jamaicans | 0.3 /100 | #260 | Tragic 54.9% |
| Ottawa | 0.3 /100 | #261 | Tragic 54.9% |
| Immigrants | St. Vincent and the Grenadines | 0.3 /100 | #262 | Tragic 54.8% |
| U.S. Virgin Islanders | 0.3 /100 | #263 | Tragic 54.8% |
Demographics Similar to Serbians by College, 1 year or more
In terms of college, 1 year or more, the demographic groups most similar to Serbians are Immigrants from Chile (61.4%, a difference of 0.010%), Venezuelan (61.3%, a difference of 0.030%), Immigrants from Jordan (61.4%, a difference of 0.10%), Immigrants from Syria (61.3%, a difference of 0.11%), and Alsatian (61.3%, a difference of 0.15%).
| Demographics | Rating | Rank | College, 1 year or more |
| Lebanese | 94.1 /100 | #116 | Exceptional 61.6% |
| Arabs | 93.9 /100 | #117 | Exceptional 61.6% |
| Immigrants | Brazil | 93.9 /100 | #118 | Exceptional 61.6% |
| Assyrians/Chaldeans/Syriacs | 93.3 /100 | #119 | Exceptional 61.5% |
| Pakistanis | 93.2 /100 | #120 | Exceptional 61.5% |
| Immigrants | Jordan | 92.7 /100 | #121 | Exceptional 61.4% |
| Immigrants | Chile | 92.3 /100 | #122 | Exceptional 61.4% |
| Serbians | 92.2 /100 | #123 | Exceptional 61.4% |
| Venezuelans | 92.1 /100 | #124 | Exceptional 61.3% |
| Immigrants | Syria | 91.6 /100 | #125 | Exceptional 61.3% |
| Alsatians | 91.3 /100 | #126 | Exceptional 61.3% |
| Immigrants | Eastern Africa | 91.1 /100 | #127 | Exceptional 61.2% |
| Immigrants | Italy | 91.1 /100 | #128 | Exceptional 61.2% |
| Ugandans | 90.7 /100 | #129 | Exceptional 61.2% |
| Italians | 89.5 /100 | #130 | Excellent 61.1% |