Maltese vs Serbian College, 1 year or more
COMPARE
Maltese
Serbian
College, 1 year or more
College, 1 year or more Comparison
Maltese
Serbians
63.4%
COLLEGE, 1 YEAR OR MORE
99.3/ 100
METRIC RATING
65th/ 347
METRIC RANK
61.4%
COLLEGE, 1 YEAR OR MORE
92.2/ 100
METRIC RATING
123rd/ 347
METRIC RANK
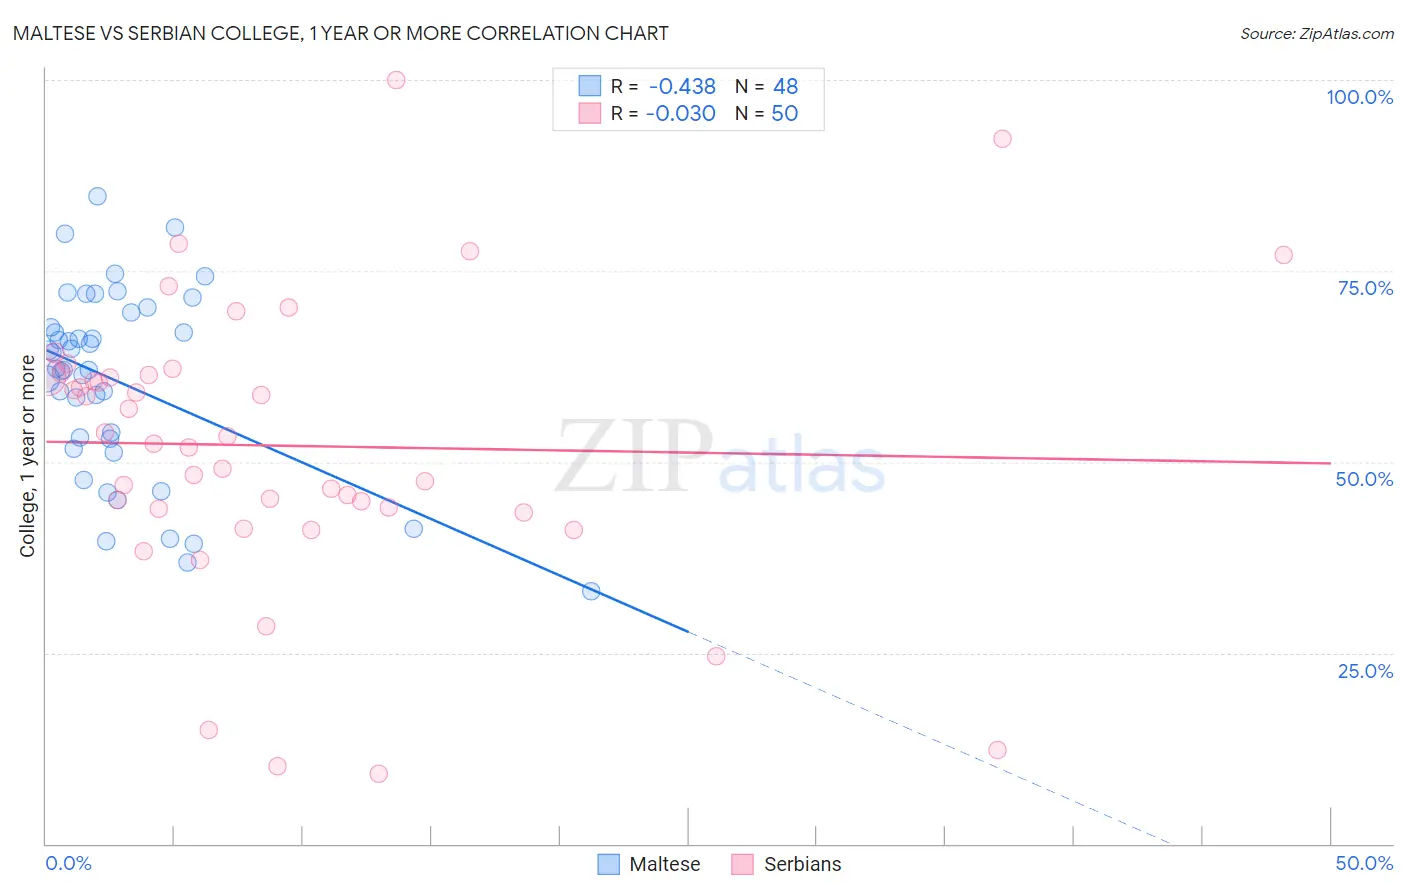
Maltese vs Serbian College, 1 year or more Correlation Chart
The statistical analysis conducted on geographies consisting of 126,478,070 people shows a moderate negative correlation between the proportion of Maltese and percentage of population with at least college, 1 year or more education in the United States with a correlation coefficient (R) of -0.438 and weighted average of 63.4%. Similarly, the statistical analysis conducted on geographies consisting of 267,640,905 people shows no correlation between the proportion of Serbians and percentage of population with at least college, 1 year or more education in the United States with a correlation coefficient (R) of -0.030 and weighted average of 61.4%, a difference of 3.3%.
College, 1 year or more Correlation Summary
| Measurement | Maltese | Serbian |
| Minimum | 33.0% | 9.2% |
| Maximum | 84.8% | 100.0% |
| Range | 51.7% | 90.8% |
| Mean | 60.5% | 52.1% |
| Median | 62.1% | 52.9% |
| Interquartile 25% (IQ1) | 52.3% | 43.9% |
| Interquartile 75% (IQ3) | 68.6% | 61.3% |
| Interquartile Range (IQR) | 16.3% | 17.4% |
| Standard Deviation (Sample) | 12.3% | 18.8% |
| Standard Deviation (Population) | 12.2% | 18.6% |
Similar Demographics by College, 1 year or more
Demographics Similar to Maltese by College, 1 year or more
In terms of college, 1 year or more, the demographic groups most similar to Maltese are Immigrants from Spain (63.4%, a difference of 0.10%), Immigrants from Europe (63.3%, a difference of 0.10%), Immigrants from Romania (63.3%, a difference of 0.12%), Immigrants from Scotland (63.4%, a difference of 0.13%), and Immigrants from Greece (63.3%, a difference of 0.14%).
| Demographics | Rating | Rank | College, 1 year or more |
| Immigrants | Asia | 99.7 /100 | #58 | Exceptional 64.0% |
| Immigrants | Serbia | 99.6 /100 | #59 | Exceptional 63.8% |
| Immigrants | Kazakhstan | 99.5 /100 | #60 | Exceptional 63.6% |
| Bolivians | 99.5 /100 | #61 | Exceptional 63.5% |
| Immigrants | Indonesia | 99.5 /100 | #62 | Exceptional 63.5% |
| Immigrants | Scotland | 99.4 /100 | #63 | Exceptional 63.4% |
| Immigrants | Spain | 99.4 /100 | #64 | Exceptional 63.4% |
| Maltese | 99.3 /100 | #65 | Exceptional 63.4% |
| Immigrants | Europe | 99.3 /100 | #66 | Exceptional 63.3% |
| Immigrants | Romania | 99.3 /100 | #67 | Exceptional 63.3% |
| Immigrants | Greece | 99.3 /100 | #68 | Exceptional 63.3% |
| Immigrants | Zimbabwe | 99.3 /100 | #69 | Exceptional 63.3% |
| Argentineans | 99.2 /100 | #70 | Exceptional 63.2% |
| Immigrants | Canada | 99.1 /100 | #71 | Exceptional 63.1% |
| Egyptians | 99.0 /100 | #72 | Exceptional 63.1% |
Demographics Similar to Serbians by College, 1 year or more
In terms of college, 1 year or more, the demographic groups most similar to Serbians are Immigrants from Chile (61.4%, a difference of 0.010%), Venezuelan (61.3%, a difference of 0.030%), Immigrants from Jordan (61.4%, a difference of 0.10%), Immigrants from Syria (61.3%, a difference of 0.11%), and Alsatian (61.3%, a difference of 0.15%).
| Demographics | Rating | Rank | College, 1 year or more |
| Lebanese | 94.1 /100 | #116 | Exceptional 61.6% |
| Arabs | 93.9 /100 | #117 | Exceptional 61.6% |
| Immigrants | Brazil | 93.9 /100 | #118 | Exceptional 61.6% |
| Assyrians/Chaldeans/Syriacs | 93.3 /100 | #119 | Exceptional 61.5% |
| Pakistanis | 93.2 /100 | #120 | Exceptional 61.5% |
| Immigrants | Jordan | 92.7 /100 | #121 | Exceptional 61.4% |
| Immigrants | Chile | 92.3 /100 | #122 | Exceptional 61.4% |
| Serbians | 92.2 /100 | #123 | Exceptional 61.4% |
| Venezuelans | 92.1 /100 | #124 | Exceptional 61.3% |
| Immigrants | Syria | 91.6 /100 | #125 | Exceptional 61.3% |
| Alsatians | 91.3 /100 | #126 | Exceptional 61.3% |
| Immigrants | Eastern Africa | 91.1 /100 | #127 | Exceptional 61.2% |
| Immigrants | Italy | 91.1 /100 | #128 | Exceptional 61.2% |
| Ugandans | 90.7 /100 | #129 | Exceptional 61.2% |
| Italians | 89.5 /100 | #130 | Excellent 61.1% |