Dutch vs Immigrants from Zimbabwe GED/Equivalency
COMPARE
Dutch
Immigrants from Zimbabwe
GED/Equivalency
GED/Equivalency Comparison
Dutch
Immigrants from Zimbabwe
87.5%
GED/EQUIVALENCY
98.1/ 100
METRIC RATING
85th/ 347
METRIC RANK
87.1%
GED/EQUIVALENCY
95.8/ 100
METRIC RATING
106th/ 347
METRIC RANK
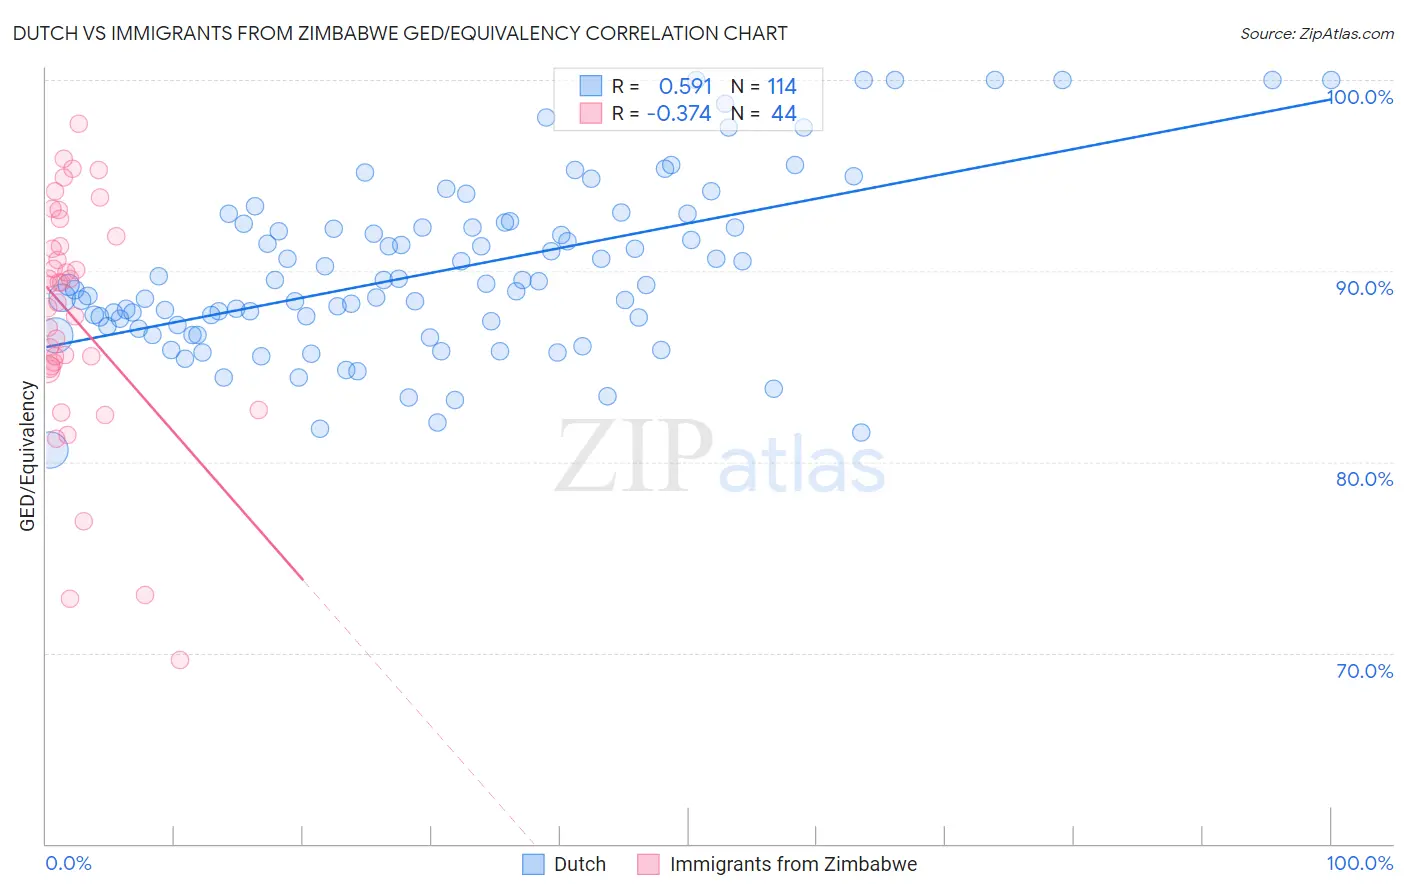
Dutch vs Immigrants from Zimbabwe GED/Equivalency Correlation Chart
The statistical analysis conducted on geographies consisting of 554,358,380 people shows a substantial positive correlation between the proportion of Dutch and percentage of population with at least ged/equivalency education in the United States with a correlation coefficient (R) of 0.591 and weighted average of 87.5%. Similarly, the statistical analysis conducted on geographies consisting of 117,809,864 people shows a mild negative correlation between the proportion of Immigrants from Zimbabwe and percentage of population with at least ged/equivalency education in the United States with a correlation coefficient (R) of -0.374 and weighted average of 87.1%, a difference of 0.42%.
GED/Equivalency Correlation Summary
| Measurement | Dutch | Immigrants from Zimbabwe |
| Minimum | 80.6% | 69.6% |
| Maximum | 100.0% | 97.7% |
| Range | 19.4% | 28.1% |
| Mean | 90.0% | 87.5% |
| Median | 89.3% | 88.8% |
| Interquartile 25% (IQ1) | 87.1% | 84.9% |
| Interquartile 75% (IQ3) | 92.3% | 91.6% |
| Interquartile Range (IQR) | 5.2% | 6.6% |
| Standard Deviation (Sample) | 4.5% | 6.2% |
| Standard Deviation (Population) | 4.4% | 6.2% |
Similar Demographics by GED/Equivalency
Demographics Similar to Dutch by GED/Equivalency
In terms of ged/equivalency, the demographic groups most similar to Dutch are Immigrants from Romania (87.5%, a difference of 0.0%), Immigrants from Europe (87.5%, a difference of 0.010%), Native Hawaiian (87.5%, a difference of 0.010%), Immigrants from Norway (87.5%, a difference of 0.020%), and South African (87.5%, a difference of 0.040%).
| Demographics | Rating | Rank | GED/Equivalency |
| Irish | 98.6 /100 | #78 | Exceptional 87.6% |
| English | 98.6 /100 | #79 | Exceptional 87.6% |
| Immigrants | England | 98.5 /100 | #80 | Exceptional 87.6% |
| Immigrants | Sri Lanka | 98.3 /100 | #81 | Exceptional 87.5% |
| Romanians | 98.3 /100 | #82 | Exceptional 87.5% |
| South Africans | 98.3 /100 | #83 | Exceptional 87.5% |
| Immigrants | Romania | 98.1 /100 | #84 | Exceptional 87.5% |
| Dutch | 98.1 /100 | #85 | Exceptional 87.5% |
| Immigrants | Europe | 98.1 /100 | #86 | Exceptional 87.5% |
| Native Hawaiians | 98.1 /100 | #87 | Exceptional 87.5% |
| Immigrants | Norway | 98.1 /100 | #88 | Exceptional 87.5% |
| Hungarians | 97.9 /100 | #89 | Exceptional 87.4% |
| Welsh | 97.9 /100 | #90 | Exceptional 87.4% |
| Immigrants | Eastern Asia | 97.9 /100 | #91 | Exceptional 87.4% |
| Israelis | 97.8 /100 | #92 | Exceptional 87.4% |
Demographics Similar to Immigrants from Zimbabwe by GED/Equivalency
In terms of ged/equivalency, the demographic groups most similar to Immigrants from Zimbabwe are Icelander (87.1%, a difference of 0.010%), Indian (Asian) (87.1%, a difference of 0.020%), Immigrants from Hungary (87.2%, a difference of 0.030%), Canadian (87.1%, a difference of 0.030%), and Jordanian (87.2%, a difference of 0.040%).
| Demographics | Rating | Rank | GED/Equivalency |
| Immigrants | Belarus | 96.9 /100 | #99 | Exceptional 87.3% |
| Palestinians | 96.8 /100 | #100 | Exceptional 87.3% |
| Syrians | 96.6 /100 | #101 | Exceptional 87.2% |
| Lebanese | 96.2 /100 | #102 | Exceptional 87.2% |
| Jordanians | 96.1 /100 | #103 | Exceptional 87.2% |
| Immigrants | Hungary | 96.0 /100 | #104 | Exceptional 87.2% |
| Indians (Asian) | 95.9 /100 | #105 | Exceptional 87.1% |
| Immigrants | Zimbabwe | 95.8 /100 | #106 | Exceptional 87.1% |
| Icelanders | 95.7 /100 | #107 | Exceptional 87.1% |
| Canadians | 95.6 /100 | #108 | Exceptional 87.1% |
| Immigrants | Eastern Europe | 95.5 /100 | #109 | Exceptional 87.1% |
| Egyptians | 95.3 /100 | #110 | Exceptional 87.1% |
| French | 95.2 /100 | #111 | Exceptional 87.1% |
| Tlingit-Haida | 94.8 /100 | #112 | Exceptional 87.0% |
| Assyrians/Chaldeans/Syriacs | 94.8 /100 | #113 | Exceptional 87.0% |