Soviet Union vs Immigrants from Zimbabwe GED/Equivalency
COMPARE
Soviet Union
Immigrants from Zimbabwe
GED/Equivalency
GED/Equivalency Comparison
Soviet Union
Immigrants from Zimbabwe
88.0%
GED/EQUIVALENCY
99.4/ 100
METRIC RATING
54th/ 347
METRIC RANK
87.1%
GED/EQUIVALENCY
95.8/ 100
METRIC RATING
106th/ 347
METRIC RANK
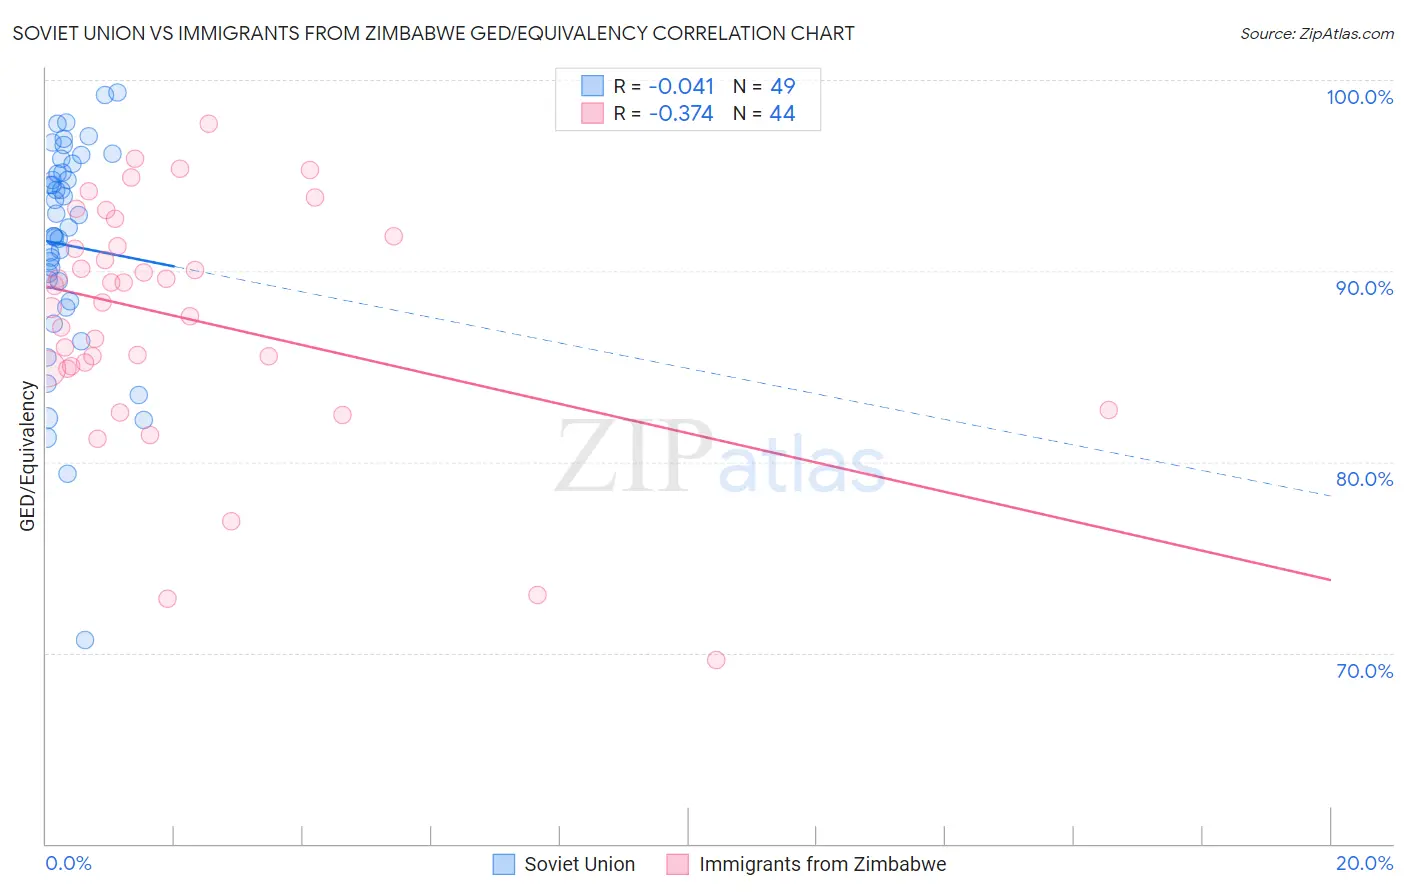
Soviet Union vs Immigrants from Zimbabwe GED/Equivalency Correlation Chart
The statistical analysis conducted on geographies consisting of 43,454,395 people shows no correlation between the proportion of Soviet Union and percentage of population with at least ged/equivalency education in the United States with a correlation coefficient (R) of -0.041 and weighted average of 88.0%. Similarly, the statistical analysis conducted on geographies consisting of 117,809,864 people shows a mild negative correlation between the proportion of Immigrants from Zimbabwe and percentage of population with at least ged/equivalency education in the United States with a correlation coefficient (R) of -0.374 and weighted average of 87.1%, a difference of 0.99%.
GED/Equivalency Correlation Summary
| Measurement | Soviet Union | Immigrants from Zimbabwe |
| Minimum | 70.7% | 69.6% |
| Maximum | 99.4% | 97.7% |
| Range | 28.7% | 28.1% |
| Mean | 91.4% | 87.5% |
| Median | 92.2% | 88.8% |
| Interquartile 25% (IQ1) | 88.9% | 84.9% |
| Interquartile 75% (IQ3) | 95.4% | 91.6% |
| Interquartile Range (IQR) | 6.5% | 6.6% |
| Standard Deviation (Sample) | 5.7% | 6.2% |
| Standard Deviation (Population) | 5.7% | 6.2% |
Similar Demographics by GED/Equivalency
Demographics Similar to Soviet Union by GED/Equivalency
In terms of ged/equivalency, the demographic groups most similar to Soviet Union are New Zealander (88.0%, a difference of 0.0%), Immigrants from Netherlands (88.0%, a difference of 0.010%), Zimbabwean (88.0%, a difference of 0.010%), Immigrants from South Africa (88.0%, a difference of 0.010%), and Immigrants from Denmark (88.0%, a difference of 0.020%).
| Demographics | Rating | Rank | GED/Equivalency |
| Immigrants | Latvia | 99.5 /100 | #47 | Exceptional 88.1% |
| Greeks | 99.5 /100 | #48 | Exceptional 88.1% |
| Australians | 99.5 /100 | #49 | Exceptional 88.1% |
| Immigrants | Korea | 99.5 /100 | #50 | Exceptional 88.1% |
| Immigrants | Netherlands | 99.4 /100 | #51 | Exceptional 88.0% |
| Zimbabweans | 99.4 /100 | #52 | Exceptional 88.0% |
| Immigrants | South Africa | 99.4 /100 | #53 | Exceptional 88.0% |
| Soviet Union | 99.4 /100 | #54 | Exceptional 88.0% |
| New Zealanders | 99.4 /100 | #55 | Exceptional 88.0% |
| Immigrants | Denmark | 99.4 /100 | #56 | Exceptional 88.0% |
| Immigrants | Czechoslovakia | 99.3 /100 | #57 | Exceptional 87.9% |
| Northern Europeans | 99.3 /100 | #58 | Exceptional 87.9% |
| Serbians | 99.3 /100 | #59 | Exceptional 87.9% |
| Scandinavians | 99.3 /100 | #60 | Exceptional 87.9% |
| Europeans | 99.3 /100 | #61 | Exceptional 87.9% |
Demographics Similar to Immigrants from Zimbabwe by GED/Equivalency
In terms of ged/equivalency, the demographic groups most similar to Immigrants from Zimbabwe are Icelander (87.1%, a difference of 0.010%), Indian (Asian) (87.1%, a difference of 0.020%), Immigrants from Hungary (87.2%, a difference of 0.030%), Canadian (87.1%, a difference of 0.030%), and Jordanian (87.2%, a difference of 0.040%).
| Demographics | Rating | Rank | GED/Equivalency |
| Immigrants | Belarus | 96.9 /100 | #99 | Exceptional 87.3% |
| Palestinians | 96.8 /100 | #100 | Exceptional 87.3% |
| Syrians | 96.6 /100 | #101 | Exceptional 87.2% |
| Lebanese | 96.2 /100 | #102 | Exceptional 87.2% |
| Jordanians | 96.1 /100 | #103 | Exceptional 87.2% |
| Immigrants | Hungary | 96.0 /100 | #104 | Exceptional 87.2% |
| Indians (Asian) | 95.9 /100 | #105 | Exceptional 87.1% |
| Immigrants | Zimbabwe | 95.8 /100 | #106 | Exceptional 87.1% |
| Icelanders | 95.7 /100 | #107 | Exceptional 87.1% |
| Canadians | 95.6 /100 | #108 | Exceptional 87.1% |
| Immigrants | Eastern Europe | 95.5 /100 | #109 | Exceptional 87.1% |
| Egyptians | 95.3 /100 | #110 | Exceptional 87.1% |
| French | 95.2 /100 | #111 | Exceptional 87.1% |
| Tlingit-Haida | 94.8 /100 | #112 | Exceptional 87.0% |
| Assyrians/Chaldeans/Syriacs | 94.8 /100 | #113 | Exceptional 87.0% |