Native/Alaskan vs Immigrants from Belarus 10th Grade
COMPARE
Native/Alaskan
Immigrants from Belarus
10th Grade
10th Grade Comparison
Natives/Alaskans
Immigrants from Belarus
92.2%
10TH GRADE
0.1/ 100
METRIC RATING
279th/ 347
METRIC RANK
94.4%
10TH GRADE
95.2/ 100
METRIC RATING
121st/ 347
METRIC RANK
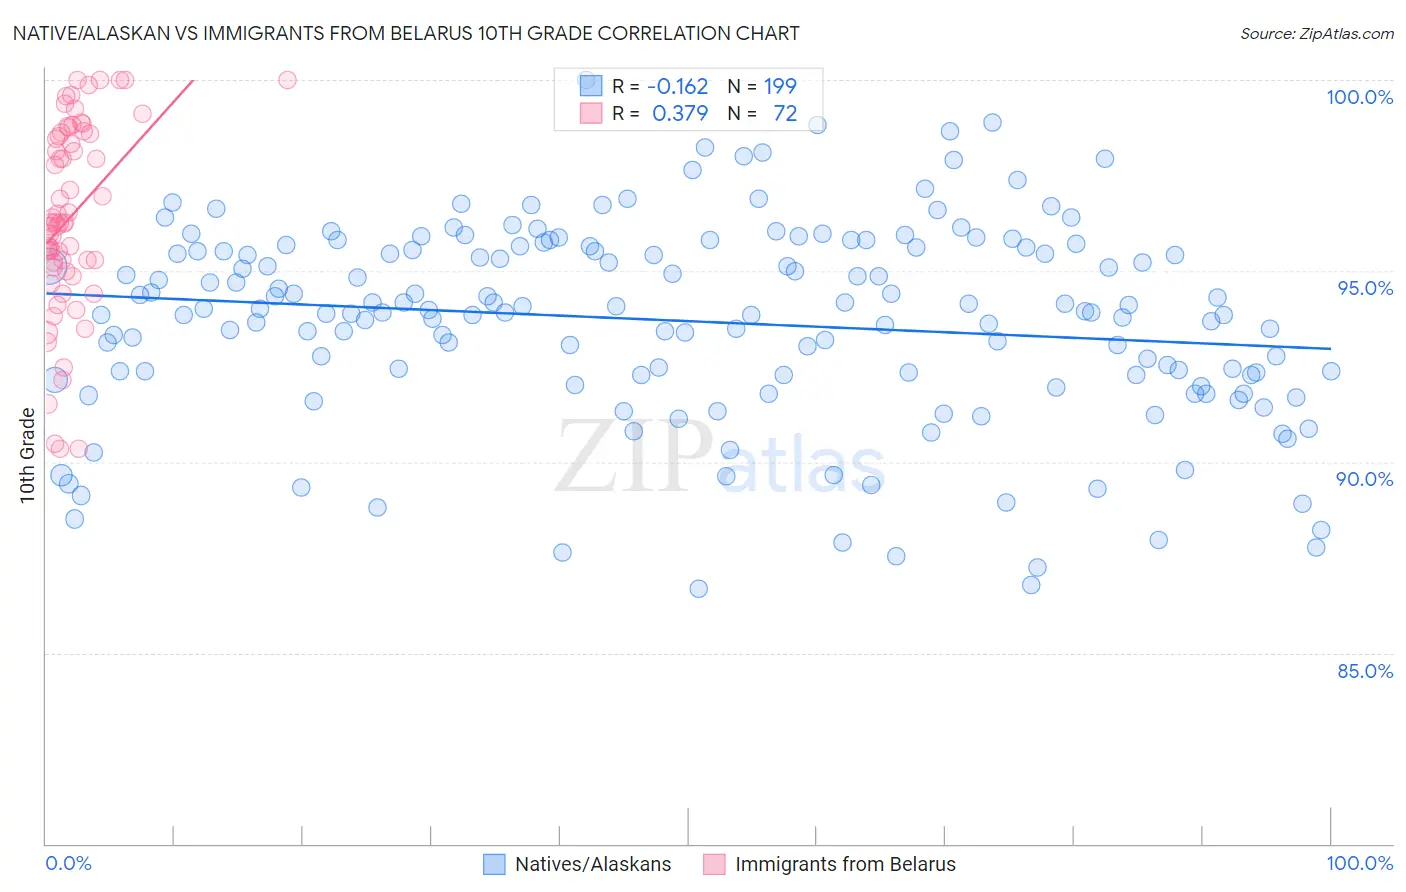
Native/Alaskan vs Immigrants from Belarus 10th Grade Correlation Chart
The statistical analysis conducted on geographies consisting of 513,060,394 people shows a poor negative correlation between the proportion of Natives/Alaskans and percentage of population with at least 10th grade education in the United States with a correlation coefficient (R) of -0.162 and weighted average of 92.2%. Similarly, the statistical analysis conducted on geographies consisting of 149,993,317 people shows a mild positive correlation between the proportion of Immigrants from Belarus and percentage of population with at least 10th grade education in the United States with a correlation coefficient (R) of 0.379 and weighted average of 94.4%, a difference of 2.3%.
10th Grade Correlation Summary
| Measurement | Native/Alaskan | Immigrants from Belarus |
| Minimum | 86.7% | 90.3% |
| Maximum | 100.0% | 100.0% |
| Range | 13.3% | 9.7% |
| Mean | 93.7% | 96.4% |
| Median | 93.9% | 96.3% |
| Interquartile 25% (IQ1) | 92.3% | 95.2% |
| Interquartile 75% (IQ3) | 95.6% | 98.6% |
| Interquartile Range (IQR) | 3.3% | 3.4% |
| Standard Deviation (Sample) | 2.6% | 2.5% |
| Standard Deviation (Population) | 2.6% | 2.5% |
Similar Demographics by 10th Grade
Demographics Similar to Natives/Alaskans by 10th Grade
In terms of 10th grade, the demographic groups most similar to Natives/Alaskans are Barbadian (92.2%, a difference of 0.010%), Malaysian (92.2%, a difference of 0.030%), Navajo (92.3%, a difference of 0.040%), Bangladeshi (92.2%, a difference of 0.040%), and Immigrants from Peru (92.2%, a difference of 0.060%).
| Demographics | Rating | Rank | 10th Grade |
| Immigrants | Western Africa | 0.3 /100 | #272 | Tragic 92.5% |
| Trinidadians and Tobagonians | 0.2 /100 | #273 | Tragic 92.4% |
| Immigrants | Congo | 0.2 /100 | #274 | Tragic 92.4% |
| West Indians | 0.2 /100 | #275 | Tragic 92.4% |
| Immigrants | Trinidad and Tobago | 0.1 /100 | #276 | Tragic 92.3% |
| Navajo | 0.1 /100 | #277 | Tragic 92.3% |
| Barbadians | 0.1 /100 | #278 | Tragic 92.2% |
| Natives/Alaskans | 0.1 /100 | #279 | Tragic 92.2% |
| Malaysians | 0.1 /100 | #280 | Tragic 92.2% |
| Bangladeshis | 0.1 /100 | #281 | Tragic 92.2% |
| Immigrants | Peru | 0.1 /100 | #282 | Tragic 92.2% |
| Immigrants | St. Vincent and the Grenadines | 0.0 /100 | #283 | Tragic 92.1% |
| Immigrants | Barbados | 0.0 /100 | #284 | Tragic 92.1% |
| Immigrants | South Eastern Asia | 0.0 /100 | #285 | Tragic 92.1% |
| Yuman | 0.0 /100 | #286 | Tragic 92.0% |
Demographics Similar to Immigrants from Belarus by 10th Grade
In terms of 10th grade, the demographic groups most similar to Immigrants from Belarus are Inupiat (94.4%, a difference of 0.0%), Cree (94.4%, a difference of 0.0%), Immigrants from Israel (94.4%, a difference of 0.010%), Immigrants from Taiwan (94.4%, a difference of 0.010%), and Basque (94.3%, a difference of 0.010%).
| Demographics | Rating | Rank | 10th Grade |
| German Russians | 96.3 /100 | #114 | Exceptional 94.4% |
| Delaware | 96.3 /100 | #115 | Exceptional 94.4% |
| Sioux | 96.2 /100 | #116 | Exceptional 94.4% |
| Immigrants | Hungary | 95.8 /100 | #117 | Exceptional 94.4% |
| Jordanians | 95.6 /100 | #118 | Exceptional 94.4% |
| Immigrants | Israel | 95.4 /100 | #119 | Exceptional 94.4% |
| Immigrants | Taiwan | 95.3 /100 | #120 | Exceptional 94.4% |
| Immigrants | Belarus | 95.2 /100 | #121 | Exceptional 94.4% |
| Inupiat | 95.1 /100 | #122 | Exceptional 94.4% |
| Cree | 95.1 /100 | #123 | Exceptional 94.4% |
| Basques | 94.9 /100 | #124 | Exceptional 94.3% |
| Americans | 94.4 /100 | #125 | Exceptional 94.3% |
| Immigrants | Iran | 94.4 /100 | #126 | Exceptional 94.3% |
| Israelis | 93.8 /100 | #127 | Exceptional 94.3% |
| Potawatomi | 93.6 /100 | #128 | Exceptional 94.3% |