Native/Alaskan vs Immigrants from Greece 10th Grade
COMPARE
Native/Alaskan
Immigrants from Greece
10th Grade
10th Grade Comparison
Natives/Alaskans
Immigrants from Greece
92.2%
10TH GRADE
0.1/ 100
METRIC RATING
279th/ 347
METRIC RANK
94.3%
10TH GRADE
92.7/ 100
METRIC RATING
130th/ 347
METRIC RANK
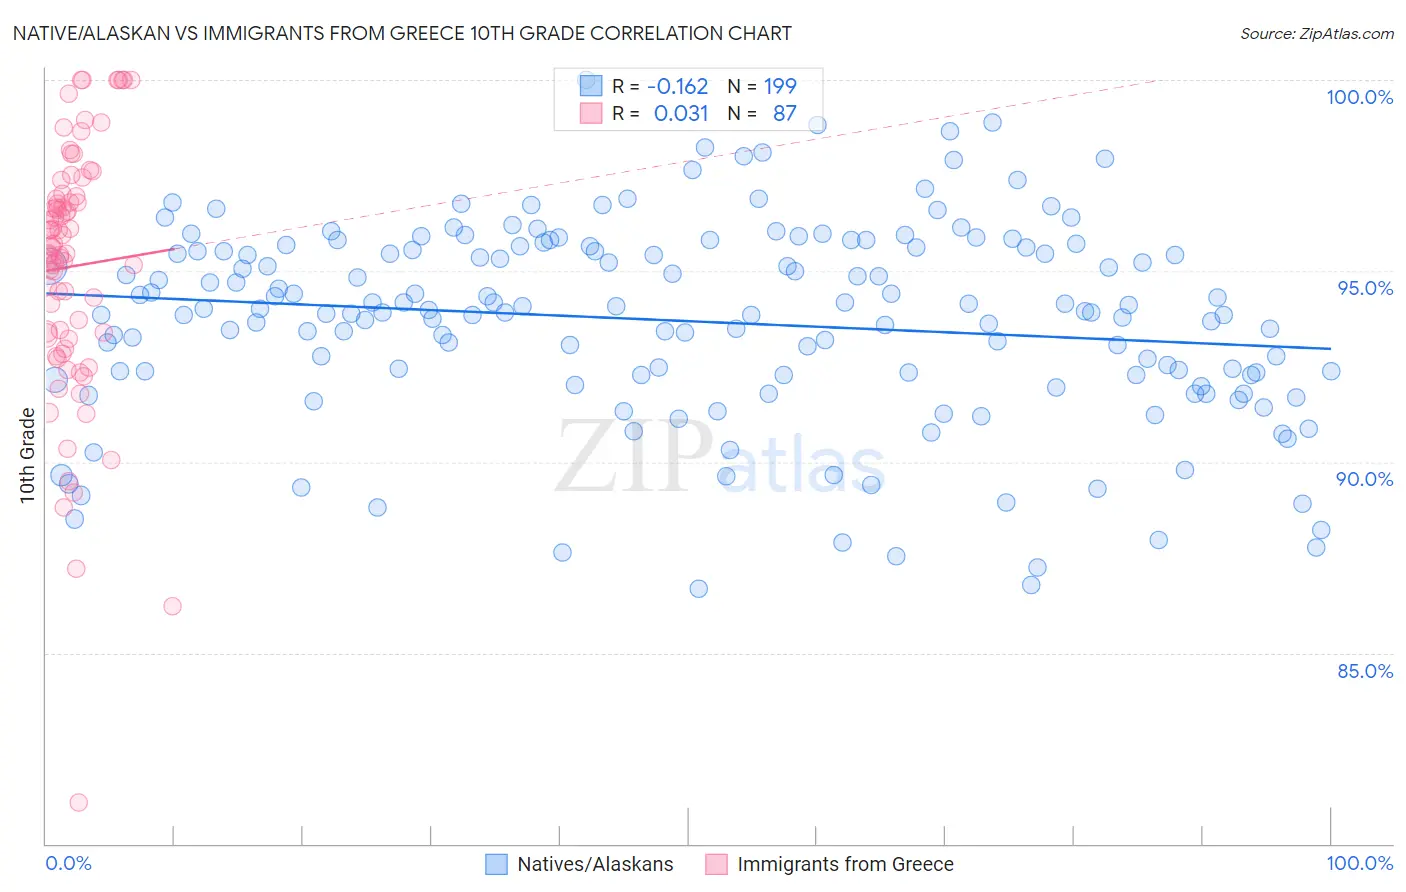
Native/Alaskan vs Immigrants from Greece 10th Grade Correlation Chart
The statistical analysis conducted on geographies consisting of 513,060,394 people shows a poor negative correlation between the proportion of Natives/Alaskans and percentage of population with at least 10th grade education in the United States with a correlation coefficient (R) of -0.162 and weighted average of 92.2%. Similarly, the statistical analysis conducted on geographies consisting of 216,879,847 people shows no correlation between the proportion of Immigrants from Greece and percentage of population with at least 10th grade education in the United States with a correlation coefficient (R) of 0.031 and weighted average of 94.3%, a difference of 2.2%.
10th Grade Correlation Summary
| Measurement | Native/Alaskan | Immigrants from Greece |
| Minimum | 86.7% | 81.1% |
| Maximum | 100.0% | 100.0% |
| Range | 13.3% | 18.9% |
| Mean | 93.7% | 95.1% |
| Median | 93.9% | 95.6% |
| Interquartile 25% (IQ1) | 92.3% | 93.3% |
| Interquartile 75% (IQ3) | 95.6% | 97.0% |
| Interquartile Range (IQR) | 3.3% | 3.7% |
| Standard Deviation (Sample) | 2.6% | 3.3% |
| Standard Deviation (Population) | 2.6% | 3.3% |
Similar Demographics by 10th Grade
Demographics Similar to Natives/Alaskans by 10th Grade
In terms of 10th grade, the demographic groups most similar to Natives/Alaskans are Barbadian (92.2%, a difference of 0.010%), Malaysian (92.2%, a difference of 0.030%), Navajo (92.3%, a difference of 0.040%), Bangladeshi (92.2%, a difference of 0.040%), and Immigrants from Peru (92.2%, a difference of 0.060%).
| Demographics | Rating | Rank | 10th Grade |
| Immigrants | Western Africa | 0.3 /100 | #272 | Tragic 92.5% |
| Trinidadians and Tobagonians | 0.2 /100 | #273 | Tragic 92.4% |
| Immigrants | Congo | 0.2 /100 | #274 | Tragic 92.4% |
| West Indians | 0.2 /100 | #275 | Tragic 92.4% |
| Immigrants | Trinidad and Tobago | 0.1 /100 | #276 | Tragic 92.3% |
| Navajo | 0.1 /100 | #277 | Tragic 92.3% |
| Barbadians | 0.1 /100 | #278 | Tragic 92.2% |
| Natives/Alaskans | 0.1 /100 | #279 | Tragic 92.2% |
| Malaysians | 0.1 /100 | #280 | Tragic 92.2% |
| Bangladeshis | 0.1 /100 | #281 | Tragic 92.2% |
| Immigrants | Peru | 0.1 /100 | #282 | Tragic 92.2% |
| Immigrants | St. Vincent and the Grenadines | 0.0 /100 | #283 | Tragic 92.1% |
| Immigrants | Barbados | 0.0 /100 | #284 | Tragic 92.1% |
| Immigrants | South Eastern Asia | 0.0 /100 | #285 | Tragic 92.1% |
| Yuman | 0.0 /100 | #286 | Tragic 92.0% |
Demographics Similar to Immigrants from Greece by 10th Grade
In terms of 10th grade, the demographic groups most similar to Immigrants from Greece are Iroquois (94.3%, a difference of 0.0%), Immigrants from Eastern Europe (94.3%, a difference of 0.010%), Immigrants from Russia (94.3%, a difference of 0.010%), Potawatomi (94.3%, a difference of 0.030%), and Creek (94.2%, a difference of 0.030%).
| Demographics | Rating | Rank | 10th Grade |
| Cree | 95.1 /100 | #123 | Exceptional 94.4% |
| Basques | 94.9 /100 | #124 | Exceptional 94.3% |
| Americans | 94.4 /100 | #125 | Exceptional 94.3% |
| Immigrants | Iran | 94.4 /100 | #126 | Exceptional 94.3% |
| Israelis | 93.8 /100 | #127 | Exceptional 94.3% |
| Potawatomi | 93.6 /100 | #128 | Exceptional 94.3% |
| Iroquois | 92.8 /100 | #129 | Exceptional 94.3% |
| Immigrants | Greece | 92.7 /100 | #130 | Exceptional 94.3% |
| Immigrants | Eastern Europe | 92.5 /100 | #131 | Exceptional 94.3% |
| Immigrants | Russia | 92.4 /100 | #132 | Exceptional 94.3% |
| Creek | 91.9 /100 | #133 | Exceptional 94.2% |
| Osage | 91.7 /100 | #134 | Exceptional 94.2% |
| Immigrants | Korea | 91.3 /100 | #135 | Exceptional 94.2% |
| Shoshone | 90.8 /100 | #136 | Exceptional 94.2% |
| Arapaho | 90.5 /100 | #137 | Exceptional 94.2% |