Lebanese vs Austrian High School Diploma
COMPARE
Lebanese
Austrian
High School Diploma
High School Diploma Comparison
Lebanese
Austrians
90.4%
HIGH SCHOOL DIPLOMA
97.4/ 100
METRIC RATING
105th/ 347
METRIC RANK
91.0%
HIGH SCHOOL DIPLOMA
99.6/ 100
METRIC RATING
62nd/ 347
METRIC RANK
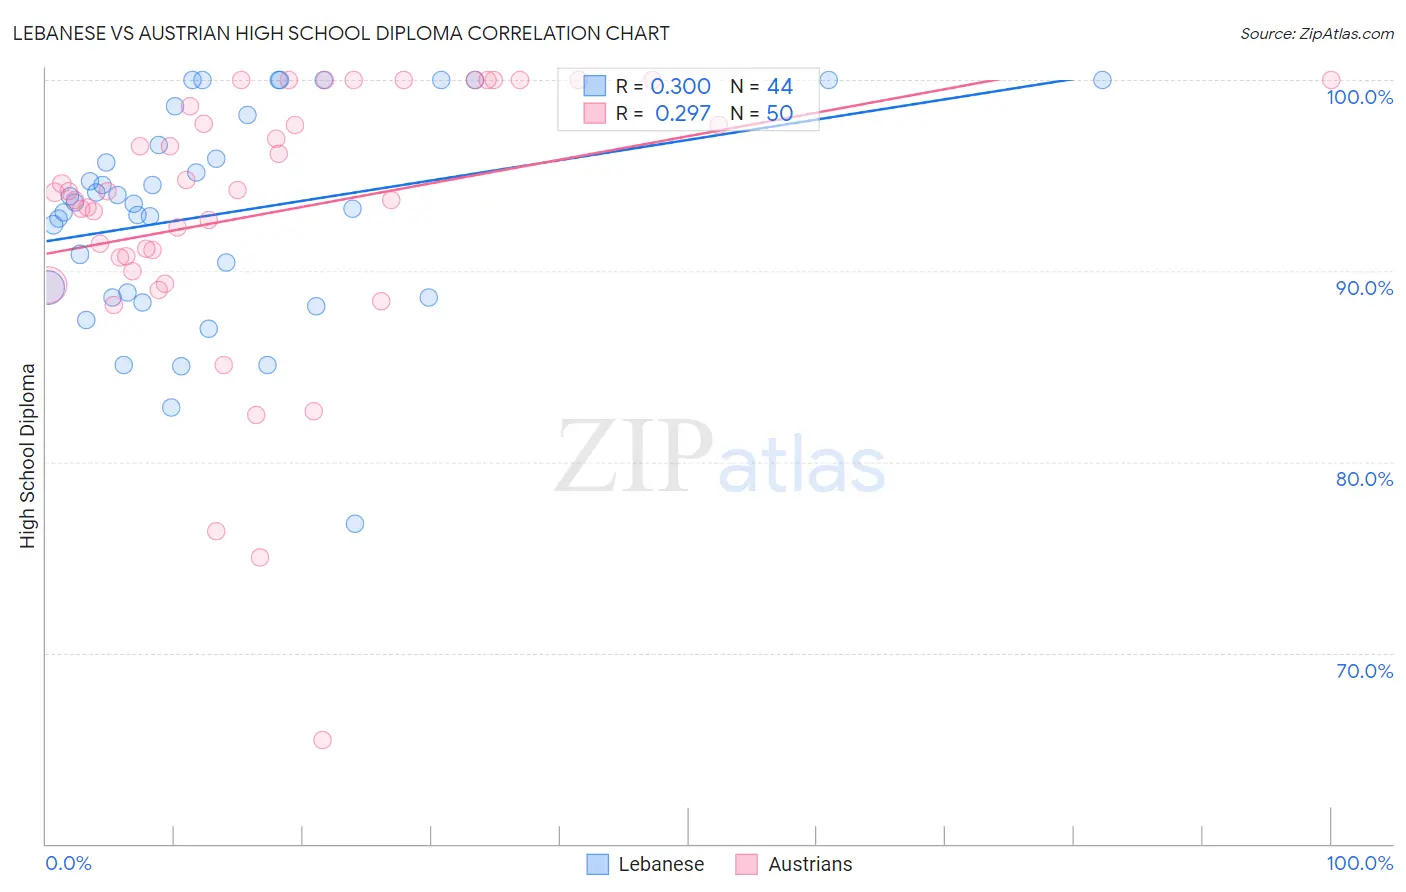
Lebanese vs Austrian High School Diploma Correlation Chart
The statistical analysis conducted on geographies consisting of 401,624,157 people shows a mild positive correlation between the proportion of Lebanese and percentage of population with at least high school diploma education in the United States with a correlation coefficient (R) of 0.300 and weighted average of 90.4%. Similarly, the statistical analysis conducted on geographies consisting of 452,082,614 people shows a weak positive correlation between the proportion of Austrians and percentage of population with at least high school diploma education in the United States with a correlation coefficient (R) of 0.297 and weighted average of 91.0%, a difference of 0.70%.
High School Diploma Correlation Summary
| Measurement | Lebanese | Austrian |
| Minimum | 76.8% | 65.4% |
| Maximum | 100.0% | 100.0% |
| Range | 23.2% | 34.6% |
| Mean | 93.0% | 93.0% |
| Median | 93.6% | 94.1% |
| Interquartile 25% (IQ1) | 88.7% | 90.7% |
| Interquartile 75% (IQ3) | 97.4% | 98.6% |
| Interquartile Range (IQR) | 8.6% | 7.9% |
| Standard Deviation (Sample) | 5.5% | 7.2% |
| Standard Deviation (Population) | 5.4% | 7.1% |
Similar Demographics by High School Diploma
Demographics Similar to Lebanese by High School Diploma
In terms of high school diploma, the demographic groups most similar to Lebanese are Syrian (90.3%, a difference of 0.050%), Immigrants from Croatia (90.4%, a difference of 0.060%), Immigrants from Romania (90.4%, a difference of 0.070%), Immigrants from Russia (90.3%, a difference of 0.070%), and Palestinian (90.3%, a difference of 0.080%).
| Demographics | Rating | Rank | High School Diploma |
| Immigrants | Korea | 98.3 /100 | #98 | Exceptional 90.5% |
| Immigrants | Europe | 98.2 /100 | #99 | Exceptional 90.5% |
| Immigrants | North Macedonia | 98.1 /100 | #100 | Exceptional 90.5% |
| Immigrants | Norway | 98.0 /100 | #101 | Exceptional 90.5% |
| Aleuts | 98.0 /100 | #102 | Exceptional 90.4% |
| Immigrants | Romania | 97.8 /100 | #103 | Exceptional 90.4% |
| Immigrants | Croatia | 97.8 /100 | #104 | Exceptional 90.4% |
| Lebanese | 97.4 /100 | #105 | Exceptional 90.4% |
| Syrians | 97.0 /100 | #106 | Exceptional 90.3% |
| Immigrants | Russia | 96.9 /100 | #107 | Exceptional 90.3% |
| Palestinians | 96.7 /100 | #108 | Exceptional 90.3% |
| Immigrants | Zimbabwe | 96.7 /100 | #109 | Exceptional 90.3% |
| Immigrants | Greece | 96.6 /100 | #110 | Exceptional 90.3% |
| Menominee | 96.6 /100 | #111 | Exceptional 90.3% |
| Immigrants | Belarus | 96.4 /100 | #112 | Exceptional 90.2% |
Demographics Similar to Austrians by High School Diploma
In terms of high school diploma, the demographic groups most similar to Austrians are Immigrants from Taiwan (91.0%, a difference of 0.020%), Immigrants from Japan (91.0%, a difference of 0.030%), Immigrants from Netherlands (91.0%, a difference of 0.030%), Ukrainian (91.0%, a difference of 0.030%), and Immigrants from South Africa (91.0%, a difference of 0.040%).
| Demographics | Rating | Rank | High School Diploma |
| Serbians | 99.7 /100 | #55 | Exceptional 91.1% |
| Immigrants | Canada | 99.7 /100 | #56 | Exceptional 91.1% |
| Zimbabweans | 99.7 /100 | #57 | Exceptional 91.1% |
| Slavs | 99.7 /100 | #58 | Exceptional 91.0% |
| Immigrants | North America | 99.7 /100 | #59 | Exceptional 91.0% |
| Immigrants | Japan | 99.6 /100 | #60 | Exceptional 91.0% |
| Immigrants | Taiwan | 99.6 /100 | #61 | Exceptional 91.0% |
| Austrians | 99.6 /100 | #62 | Exceptional 91.0% |
| Immigrants | Netherlands | 99.6 /100 | #63 | Exceptional 91.0% |
| Ukrainians | 99.6 /100 | #64 | Exceptional 91.0% |
| Immigrants | South Africa | 99.6 /100 | #65 | Exceptional 91.0% |
| French | 99.5 /100 | #66 | Exceptional 91.0% |
| Immigrants | Iran | 99.5 /100 | #67 | Exceptional 90.9% |
| Czechoslovakians | 99.5 /100 | #68 | Exceptional 90.9% |
| French Canadians | 99.5 /100 | #69 | Exceptional 90.9% |