Native Hawaiian vs Shoshone Bachelor's Degree
COMPARE
Native Hawaiian
Shoshone
Bachelor's Degree
Bachelor's Degree Comparison
Native Hawaiians
Shoshone
33.2%
BACHELOR'S DEGREE
0.7/ 100
METRIC RATING
254th/ 347
METRIC RANK
29.3%
BACHELOR'S DEGREE
0.0/ 100
METRIC RATING
314th/ 347
METRIC RANK
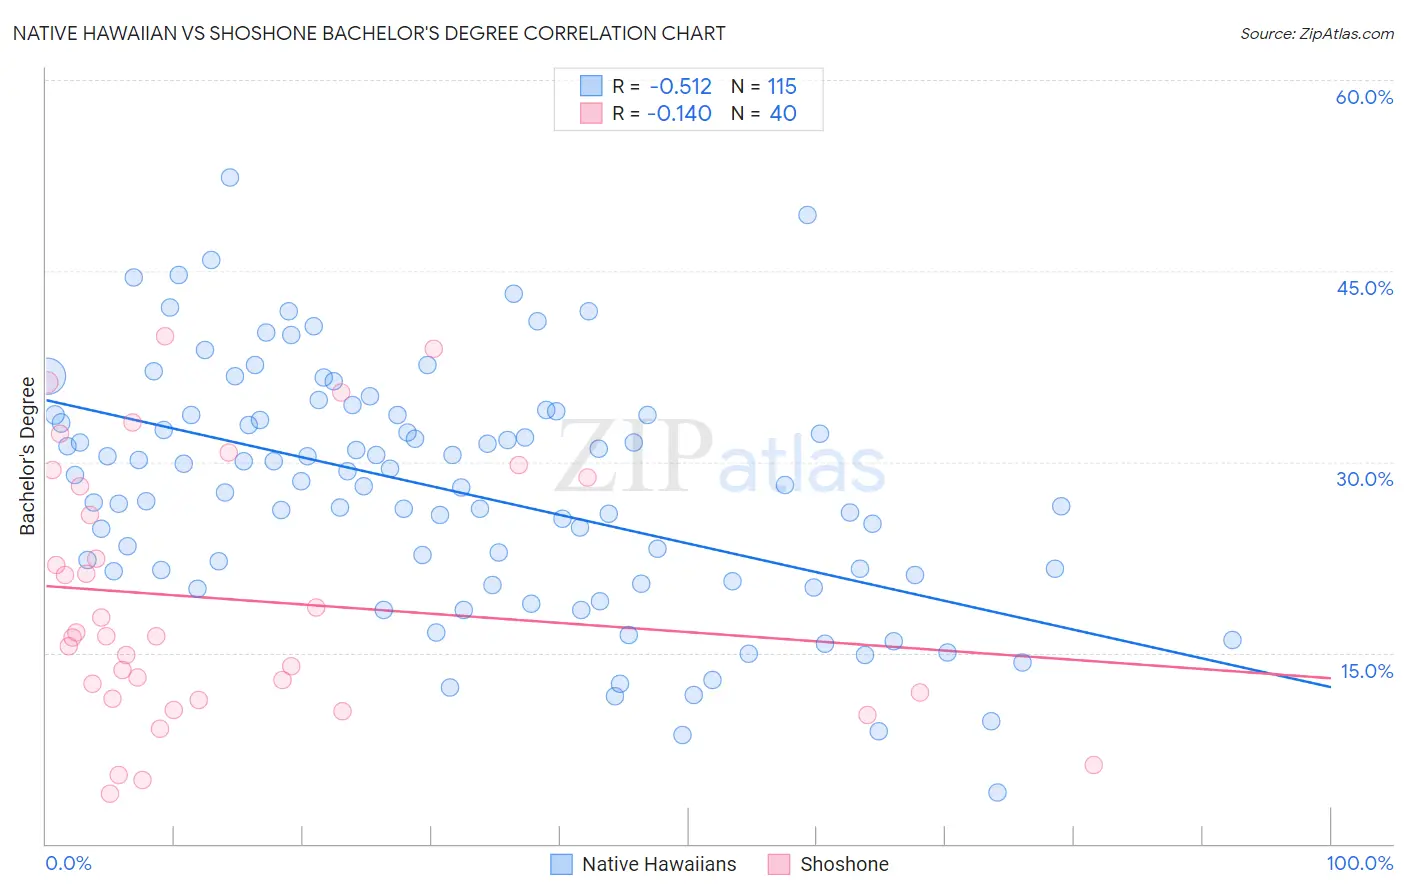
Native Hawaiian vs Shoshone Bachelor's Degree Correlation Chart
The statistical analysis conducted on geographies consisting of 332,091,621 people shows a substantial negative correlation between the proportion of Native Hawaiians and percentage of population with at least bachelor's degree education in the United States with a correlation coefficient (R) of -0.512 and weighted average of 33.2%. Similarly, the statistical analysis conducted on geographies consisting of 66,627,292 people shows a poor negative correlation between the proportion of Shoshone and percentage of population with at least bachelor's degree education in the United States with a correlation coefficient (R) of -0.140 and weighted average of 29.3%, a difference of 13.5%.
Bachelor's Degree Correlation Summary
| Measurement | Native Hawaiian | Shoshone |
| Minimum | 4.0% | 4.0% |
| Maximum | 52.3% | 39.8% |
| Range | 48.3% | 35.9% |
| Mean | 27.7% | 19.2% |
| Median | 28.2% | 16.3% |
| Interquartile 25% (IQ1) | 21.1% | 11.6% |
| Interquartile 75% (IQ3) | 33.6% | 28.4% |
| Interquartile Range (IQR) | 12.5% | 16.8% |
| Standard Deviation (Sample) | 9.4% | 10.0% |
| Standard Deviation (Population) | 9.4% | 9.8% |
Similar Demographics by Bachelor's Degree
Demographics Similar to Native Hawaiians by Bachelor's Degree
In terms of bachelor's degree, the demographic groups most similar to Native Hawaiians are Iroquois (33.2%, a difference of 0.020%), U.S. Virgin Islander (33.2%, a difference of 0.060%), Nicaraguan (33.1%, a difference of 0.20%), Immigrants from Bahamas (33.3%, a difference of 0.27%), and Japanese (33.3%, a difference of 0.34%).
| Demographics | Rating | Rank | Bachelor's Degree |
| Immigrants | Congo | 1.0 /100 | #247 | Tragic 33.6% |
| Cree | 1.0 /100 | #248 | Tragic 33.6% |
| Immigrants | Liberia | 0.9 /100 | #249 | Tragic 33.5% |
| Indonesians | 0.9 /100 | #250 | Tragic 33.5% |
| Japanese | 0.7 /100 | #251 | Tragic 33.3% |
| Immigrants | Bahamas | 0.7 /100 | #252 | Tragic 33.3% |
| U.S. Virgin Islanders | 0.7 /100 | #253 | Tragic 33.2% |
| Native Hawaiians | 0.7 /100 | #254 | Tragic 33.2% |
| Iroquois | 0.7 /100 | #255 | Tragic 33.2% |
| Nicaraguans | 0.6 /100 | #256 | Tragic 33.1% |
| Spanish Americans | 0.6 /100 | #257 | Tragic 33.1% |
| French American Indians | 0.6 /100 | #258 | Tragic 33.1% |
| Osage | 0.5 /100 | #259 | Tragic 33.0% |
| Malaysians | 0.5 /100 | #260 | Tragic 32.9% |
| Africans | 0.5 /100 | #261 | Tragic 32.9% |
Demographics Similar to Shoshone by Bachelor's Degree
In terms of bachelor's degree, the demographic groups most similar to Shoshone are Immigrants from Cabo Verde (29.2%, a difference of 0.080%), Alaska Native (29.4%, a difference of 0.29%), Seminole (29.4%, a difference of 0.48%), Choctaw (29.4%, a difference of 0.53%), and Cheyenne (29.4%, a difference of 0.60%).
| Demographics | Rating | Rank | Bachelor's Degree |
| Nepalese | 0.0 /100 | #307 | Tragic 29.9% |
| Cajuns | 0.0 /100 | #308 | Tragic 29.6% |
| Hispanics or Latinos | 0.0 /100 | #309 | Tragic 29.6% |
| Cheyenne | 0.0 /100 | #310 | Tragic 29.4% |
| Choctaw | 0.0 /100 | #311 | Tragic 29.4% |
| Seminole | 0.0 /100 | #312 | Tragic 29.4% |
| Alaska Natives | 0.0 /100 | #313 | Tragic 29.4% |
| Shoshone | 0.0 /100 | #314 | Tragic 29.3% |
| Immigrants | Cabo Verde | 0.0 /100 | #315 | Tragic 29.2% |
| Sioux | 0.0 /100 | #316 | Tragic 29.1% |
| Colville | 0.0 /100 | #317 | Tragic 29.0% |
| Yaqui | 0.0 /100 | #318 | Tragic 29.0% |
| Creek | 0.0 /100 | #319 | Tragic 28.9% |
| Kiowa | 0.0 /100 | #320 | Tragic 28.8% |
| Alaskan Athabascans | 0.0 /100 | #321 | Tragic 28.8% |