Native Hawaiian vs Seminole Doctorate Degree
COMPARE
Native Hawaiian
Seminole
Doctorate Degree
Doctorate Degree Comparison
Native Hawaiians
Seminole
1.6%
DOCTORATE DEGREE
2.1/ 100
METRIC RATING
243rd/ 347
METRIC RANK
1.3%
DOCTORATE DEGREE
0.1/ 100
METRIC RATING
322nd/ 347
METRIC RANK
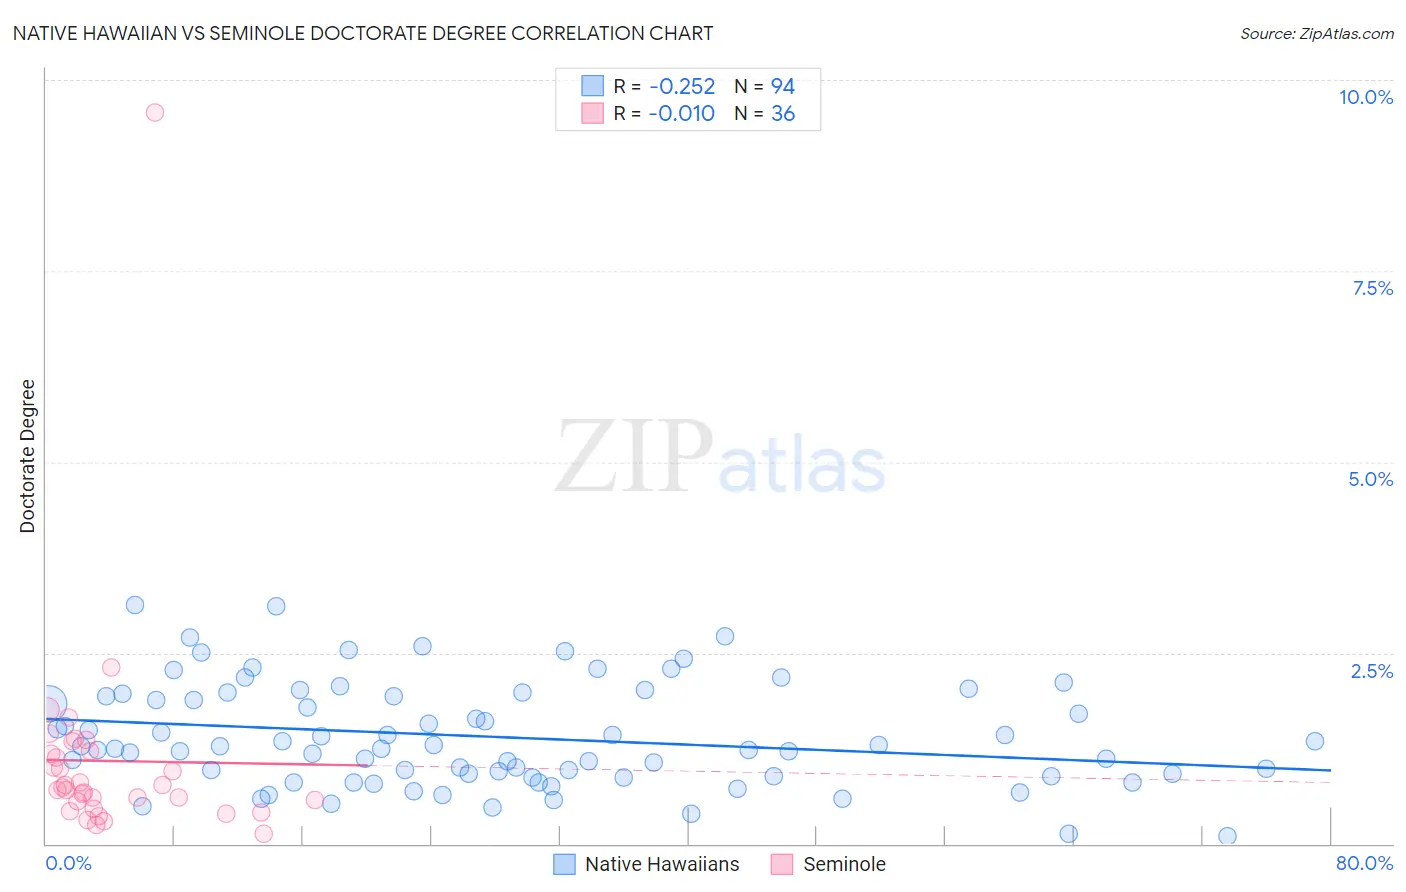
Native Hawaiian vs Seminole Doctorate Degree Correlation Chart
The statistical analysis conducted on geographies consisting of 328,309,931 people shows a weak negative correlation between the proportion of Native Hawaiians and percentage of population with at least doctorate degree education in the United States with a correlation coefficient (R) of -0.252 and weighted average of 1.6%. Similarly, the statistical analysis conducted on geographies consisting of 117,553,493 people shows no correlation between the proportion of Seminole and percentage of population with at least doctorate degree education in the United States with a correlation coefficient (R) of -0.010 and weighted average of 1.3%, a difference of 18.8%.
Doctorate Degree Correlation Summary
| Measurement | Native Hawaiian | Seminole |
| Minimum | 0.092% | 0.13% |
| Maximum | 3.1% | 9.6% |
| Range | 3.0% | 9.4% |
| Mean | 1.4% | 1.1% |
| Median | 1.3% | 0.72% |
| Interquartile 25% (IQ1) | 0.89% | 0.51% |
| Interquartile 75% (IQ3) | 1.9% | 1.2% |
| Interquartile Range (IQR) | 1.1% | 0.69% |
| Standard Deviation (Sample) | 0.67% | 1.5% |
| Standard Deviation (Population) | 0.67% | 1.5% |
Similar Demographics by Doctorate Degree
Demographics Similar to Native Hawaiians by Doctorate Degree
In terms of doctorate degree, the demographic groups most similar to Native Hawaiians are Ottawa (1.6%, a difference of 0.13%), French American Indian (1.6%, a difference of 0.19%), Cheyenne (1.6%, a difference of 0.34%), Immigrants from Panama (1.6%, a difference of 0.53%), and Delaware (1.6%, a difference of 0.57%).
| Demographics | Rating | Rank | Doctorate Degree |
| Indonesians | 2.8 /100 | #236 | Tragic 1.6% |
| Iroquois | 2.7 /100 | #237 | Tragic 1.6% |
| Immigrants | Congo | 2.6 /100 | #238 | Tragic 1.6% |
| West Indians | 2.5 /100 | #239 | Tragic 1.6% |
| Immigrants | Panama | 2.4 /100 | #240 | Tragic 1.6% |
| Cheyenne | 2.3 /100 | #241 | Tragic 1.6% |
| Ottawa | 2.2 /100 | #242 | Tragic 1.6% |
| Native Hawaiians | 2.1 /100 | #243 | Tragic 1.6% |
| French American Indians | 2.0 /100 | #244 | Tragic 1.6% |
| Delaware | 1.9 /100 | #245 | Tragic 1.6% |
| Hmong | 1.8 /100 | #246 | Tragic 1.6% |
| Comanche | 1.8 /100 | #247 | Tragic 1.6% |
| Africans | 1.8 /100 | #248 | Tragic 1.6% |
| Potawatomi | 1.6 /100 | #249 | Tragic 1.6% |
| Immigrants | Fiji | 1.6 /100 | #250 | Tragic 1.6% |
Demographics Similar to Seminole by Doctorate Degree
In terms of doctorate degree, the demographic groups most similar to Seminole are Dutch West Indian (1.3%, a difference of 0.060%), Immigrants from St. Vincent and the Grenadines (1.3%, a difference of 0.16%), Immigrants from Belize (1.3%, a difference of 0.20%), Immigrants from Guyana (1.3%, a difference of 0.23%), and Native/Alaskan (1.3%, a difference of 0.52%).
| Demographics | Rating | Rank | Doctorate Degree |
| Immigrants | Azores | 0.1 /100 | #315 | Tragic 1.4% |
| Navajo | 0.1 /100 | #316 | Tragic 1.4% |
| Immigrants | Micronesia | 0.1 /100 | #317 | Tragic 1.3% |
| Creek | 0.1 /100 | #318 | Tragic 1.3% |
| Immigrants | Guyana | 0.1 /100 | #319 | Tragic 1.3% |
| Immigrants | St. Vincent and the Grenadines | 0.1 /100 | #320 | Tragic 1.3% |
| Dutch West Indians | 0.1 /100 | #321 | Tragic 1.3% |
| Seminole | 0.1 /100 | #322 | Tragic 1.3% |
| Immigrants | Belize | 0.1 /100 | #323 | Tragic 1.3% |
| Natives/Alaskans | 0.0 /100 | #324 | Tragic 1.3% |
| Pima | 0.0 /100 | #325 | Tragic 1.3% |
| Immigrants | Cabo Verde | 0.0 /100 | #326 | Tragic 1.3% |
| Hispanics or Latinos | 0.0 /100 | #327 | Tragic 1.3% |
| Inupiat | 0.0 /100 | #328 | Tragic 1.3% |
| Haitians | 0.0 /100 | #329 | Tragic 1.3% |