Native Hawaiian vs Bulgarian Doctorate Degree
COMPARE
Native Hawaiian
Bulgarian
Doctorate Degree
Doctorate Degree Comparison
Native Hawaiians
Bulgarians
1.6%
DOCTORATE DEGREE
2.1/ 100
METRIC RATING
243rd/ 347
METRIC RANK
2.4%
DOCTORATE DEGREE
100.0/ 100
METRIC RATING
52nd/ 347
METRIC RANK
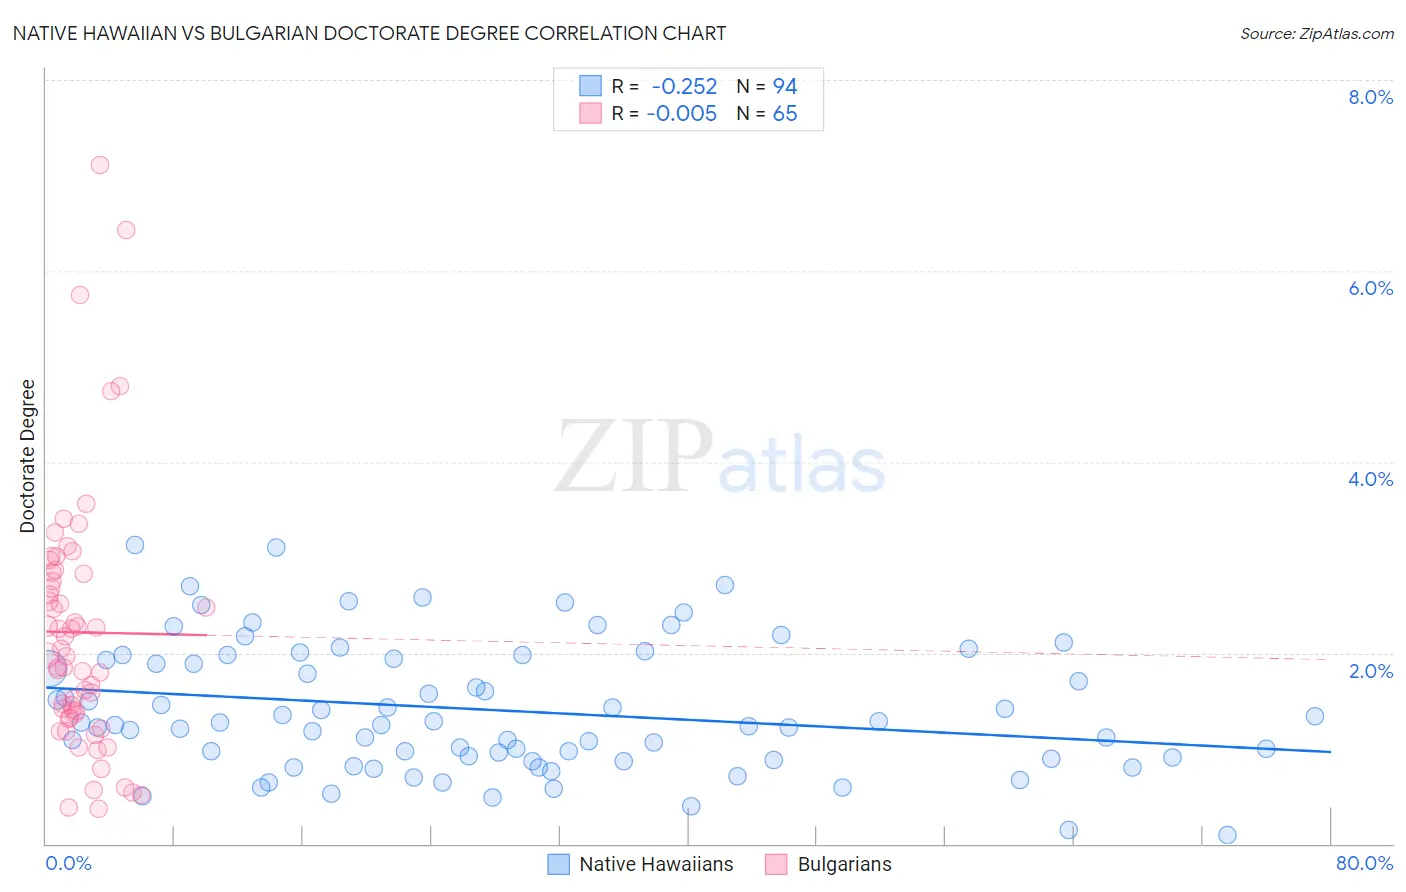
Native Hawaiian vs Bulgarian Doctorate Degree Correlation Chart
The statistical analysis conducted on geographies consisting of 328,309,931 people shows a weak negative correlation between the proportion of Native Hawaiians and percentage of population with at least doctorate degree education in the United States with a correlation coefficient (R) of -0.252 and weighted average of 1.6%. Similarly, the statistical analysis conducted on geographies consisting of 204,907,048 people shows no correlation between the proportion of Bulgarians and percentage of population with at least doctorate degree education in the United States with a correlation coefficient (R) of -0.005 and weighted average of 2.4%, a difference of 50.9%.
Doctorate Degree Correlation Summary
| Measurement | Native Hawaiian | Bulgarian |
| Minimum | 0.092% | 0.36% |
| Maximum | 3.1% | 7.1% |
| Range | 3.0% | 6.7% |
| Mean | 1.4% | 2.2% |
| Median | 1.3% | 2.0% |
| Interquartile 25% (IQ1) | 0.89% | 1.3% |
| Interquartile 75% (IQ3) | 1.9% | 2.8% |
| Interquartile Range (IQR) | 1.1% | 1.5% |
| Standard Deviation (Sample) | 0.67% | 1.3% |
| Standard Deviation (Population) | 0.67% | 1.3% |
Similar Demographics by Doctorate Degree
Demographics Similar to Native Hawaiians by Doctorate Degree
In terms of doctorate degree, the demographic groups most similar to Native Hawaiians are Ottawa (1.6%, a difference of 0.13%), French American Indian (1.6%, a difference of 0.19%), Cheyenne (1.6%, a difference of 0.34%), Immigrants from Panama (1.6%, a difference of 0.53%), and Delaware (1.6%, a difference of 0.57%).
| Demographics | Rating | Rank | Doctorate Degree |
| Indonesians | 2.8 /100 | #236 | Tragic 1.6% |
| Iroquois | 2.7 /100 | #237 | Tragic 1.6% |
| Immigrants | Congo | 2.6 /100 | #238 | Tragic 1.6% |
| West Indians | 2.5 /100 | #239 | Tragic 1.6% |
| Immigrants | Panama | 2.4 /100 | #240 | Tragic 1.6% |
| Cheyenne | 2.3 /100 | #241 | Tragic 1.6% |
| Ottawa | 2.2 /100 | #242 | Tragic 1.6% |
| Native Hawaiians | 2.1 /100 | #243 | Tragic 1.6% |
| French American Indians | 2.0 /100 | #244 | Tragic 1.6% |
| Delaware | 1.9 /100 | #245 | Tragic 1.6% |
| Hmong | 1.8 /100 | #246 | Tragic 1.6% |
| Comanche | 1.8 /100 | #247 | Tragic 1.6% |
| Africans | 1.8 /100 | #248 | Tragic 1.6% |
| Potawatomi | 1.6 /100 | #249 | Tragic 1.6% |
| Immigrants | Fiji | 1.6 /100 | #250 | Tragic 1.6% |
Demographics Similar to Bulgarians by Doctorate Degree
In terms of doctorate degree, the demographic groups most similar to Bulgarians are Immigrants from Latvia (2.4%, a difference of 0.12%), Australian (2.4%, a difference of 0.47%), Immigrants from Norway (2.4%, a difference of 0.56%), Immigrants from Indonesia (2.4%, a difference of 0.80%), and Bolivian (2.4%, a difference of 0.88%).
| Demographics | Rating | Rank | Doctorate Degree |
| Immigrants | South Africa | 100.0 /100 | #45 | Exceptional 2.4% |
| Immigrants | Austria | 100.0 /100 | #46 | Exceptional 2.4% |
| Immigrants | Western Europe | 100.0 /100 | #47 | Exceptional 2.4% |
| Asians | 100.0 /100 | #48 | Exceptional 2.4% |
| Immigrants | Asia | 100.0 /100 | #49 | Exceptional 2.4% |
| Immigrants | Norway | 100.0 /100 | #50 | Exceptional 2.4% |
| Australians | 100.0 /100 | #51 | Exceptional 2.4% |
| Bulgarians | 100.0 /100 | #52 | Exceptional 2.4% |
| Immigrants | Latvia | 100.0 /100 | #53 | Exceptional 2.4% |
| Immigrants | Indonesia | 100.0 /100 | #54 | Exceptional 2.4% |
| Bolivians | 100.0 /100 | #55 | Exceptional 2.4% |
| Immigrants | Czechoslovakia | 100.0 /100 | #56 | Exceptional 2.4% |
| Immigrants | Ethiopia | 100.0 /100 | #57 | Exceptional 2.4% |
| Ethiopians | 99.9 /100 | #58 | Exceptional 2.3% |
| South Africans | 99.9 /100 | #59 | Exceptional 2.3% |