Native Hawaiian vs Puget Sound Salish Doctorate Degree
COMPARE
Native Hawaiian
Puget Sound Salish
Doctorate Degree
Doctorate Degree Comparison
Native Hawaiians
Puget Sound Salish
1.6%
DOCTORATE DEGREE
2.1/ 100
METRIC RATING
243rd/ 347
METRIC RANK
1.2%
DOCTORATE DEGREE
0.0/ 100
METRIC RATING
338th/ 347
METRIC RANK
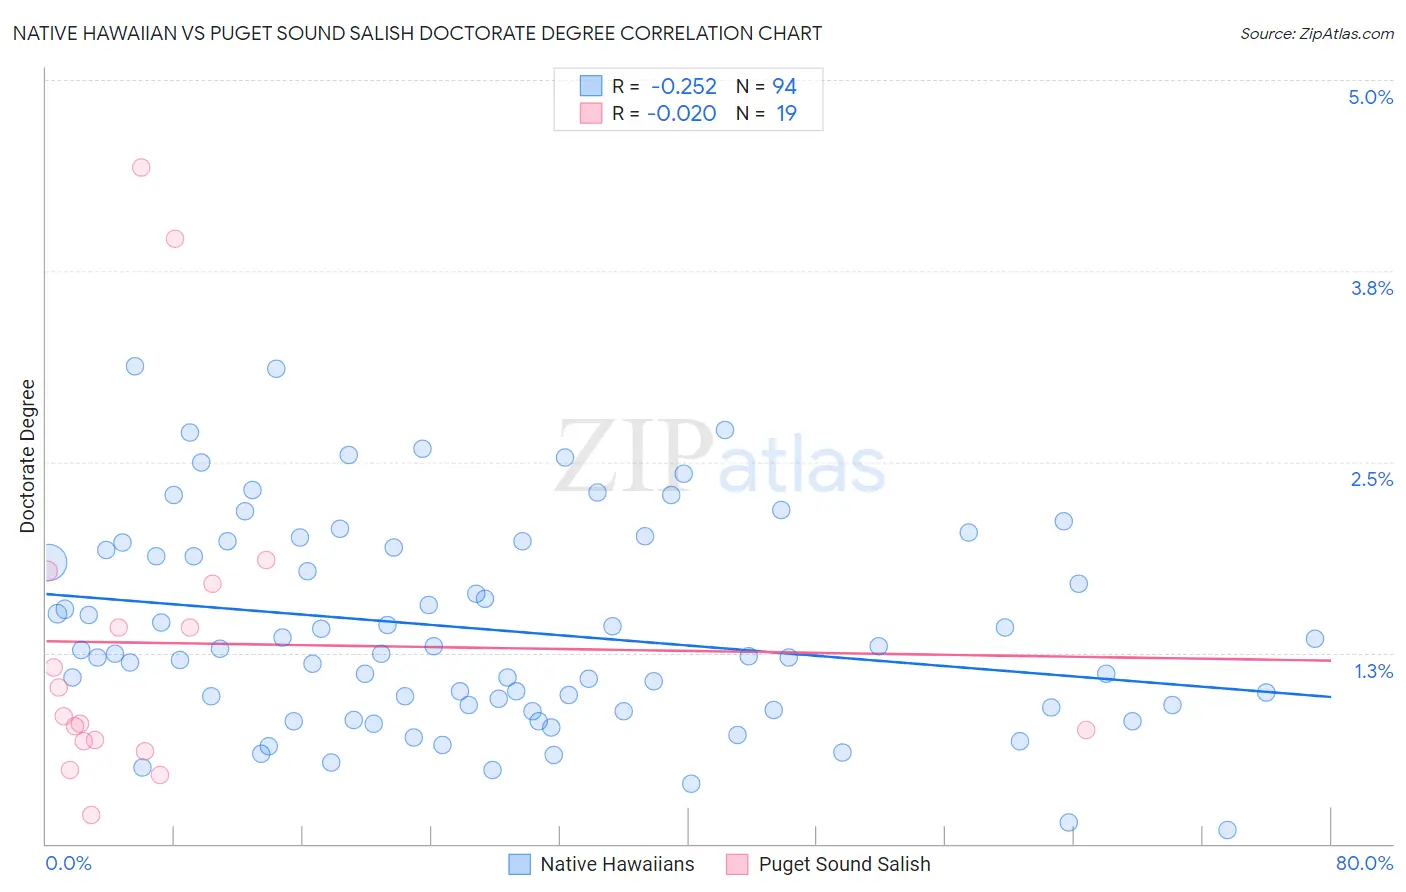
Native Hawaiian vs Puget Sound Salish Doctorate Degree Correlation Chart
The statistical analysis conducted on geographies consisting of 328,309,931 people shows a weak negative correlation between the proportion of Native Hawaiians and percentage of population with at least doctorate degree education in the United States with a correlation coefficient (R) of -0.252 and weighted average of 1.6%. Similarly, the statistical analysis conducted on geographies consisting of 45,861,164 people shows no correlation between the proportion of Puget Sound Salish and percentage of population with at least doctorate degree education in the United States with a correlation coefficient (R) of -0.020 and weighted average of 1.2%, a difference of 31.5%.
Doctorate Degree Correlation Summary
| Measurement | Native Hawaiian | Puget Sound Salish |
| Minimum | 0.092% | 0.19% |
| Maximum | 3.1% | 4.4% |
| Range | 3.0% | 4.2% |
| Mean | 1.4% | 1.3% |
| Median | 1.3% | 0.83% |
| Interquartile 25% (IQ1) | 0.89% | 0.67% |
| Interquartile 75% (IQ3) | 1.9% | 1.7% |
| Interquartile Range (IQR) | 1.1% | 1.0% |
| Standard Deviation (Sample) | 0.67% | 1.1% |
| Standard Deviation (Population) | 0.67% | 1.1% |
Similar Demographics by Doctorate Degree
Demographics Similar to Native Hawaiians by Doctorate Degree
In terms of doctorate degree, the demographic groups most similar to Native Hawaiians are Ottawa (1.6%, a difference of 0.13%), French American Indian (1.6%, a difference of 0.19%), Cheyenne (1.6%, a difference of 0.34%), Immigrants from Panama (1.6%, a difference of 0.53%), and Delaware (1.6%, a difference of 0.57%).
| Demographics | Rating | Rank | Doctorate Degree |
| Indonesians | 2.8 /100 | #236 | Tragic 1.6% |
| Iroquois | 2.7 /100 | #237 | Tragic 1.6% |
| Immigrants | Congo | 2.6 /100 | #238 | Tragic 1.6% |
| West Indians | 2.5 /100 | #239 | Tragic 1.6% |
| Immigrants | Panama | 2.4 /100 | #240 | Tragic 1.6% |
| Cheyenne | 2.3 /100 | #241 | Tragic 1.6% |
| Ottawa | 2.2 /100 | #242 | Tragic 1.6% |
| Native Hawaiians | 2.1 /100 | #243 | Tragic 1.6% |
| French American Indians | 2.0 /100 | #244 | Tragic 1.6% |
| Delaware | 1.9 /100 | #245 | Tragic 1.6% |
| Hmong | 1.8 /100 | #246 | Tragic 1.6% |
| Comanche | 1.8 /100 | #247 | Tragic 1.6% |
| Africans | 1.8 /100 | #248 | Tragic 1.6% |
| Potawatomi | 1.6 /100 | #249 | Tragic 1.6% |
| Immigrants | Fiji | 1.6 /100 | #250 | Tragic 1.6% |
Demographics Similar to Puget Sound Salish by Doctorate Degree
In terms of doctorate degree, the demographic groups most similar to Puget Sound Salish are Bangladeshi (1.2%, a difference of 0.75%), Immigrants from Central America (1.2%, a difference of 1.3%), Immigrants from Cuba (1.2%, a difference of 2.1%), Mexican (1.2%, a difference of 2.6%), and Arapaho (1.2%, a difference of 3.0%).
| Demographics | Rating | Rank | Doctorate Degree |
| Immigrants | Latin America | 0.0 /100 | #331 | Tragic 1.3% |
| Yakama | 0.0 /100 | #332 | Tragic 1.3% |
| Immigrants | Caribbean | 0.0 /100 | #333 | Tragic 1.3% |
| Immigrants | Dominican Republic | 0.0 /100 | #334 | Tragic 1.3% |
| Immigrants | Haiti | 0.0 /100 | #335 | Tragic 1.3% |
| Nepalese | 0.0 /100 | #336 | Tragic 1.3% |
| Bangladeshis | 0.0 /100 | #337 | Tragic 1.2% |
| Puget Sound Salish | 0.0 /100 | #338 | Tragic 1.2% |
| Immigrants | Central America | 0.0 /100 | #339 | Tragic 1.2% |
| Immigrants | Cuba | 0.0 /100 | #340 | Tragic 1.2% |
| Mexicans | 0.0 /100 | #341 | Tragic 1.2% |
| Arapaho | 0.0 /100 | #342 | Tragic 1.2% |
| Fijians | 0.0 /100 | #343 | Tragic 1.1% |
| Immigrants | Mexico | 0.0 /100 | #344 | Tragic 1.1% |
| Lumbee | 0.0 /100 | #345 | Tragic 1.1% |