Native Hawaiian vs Immigrants from Kenya Bachelor's Degree
COMPARE
Native Hawaiian
Immigrants from Kenya
Bachelor's Degree
Bachelor's Degree Comparison
Native Hawaiians
Immigrants from Kenya
33.2%
BACHELOR'S DEGREE
0.7/ 100
METRIC RATING
254th/ 347
METRIC RANK
38.8%
BACHELOR'S DEGREE
73.8/ 100
METRIC RATING
155th/ 347
METRIC RANK
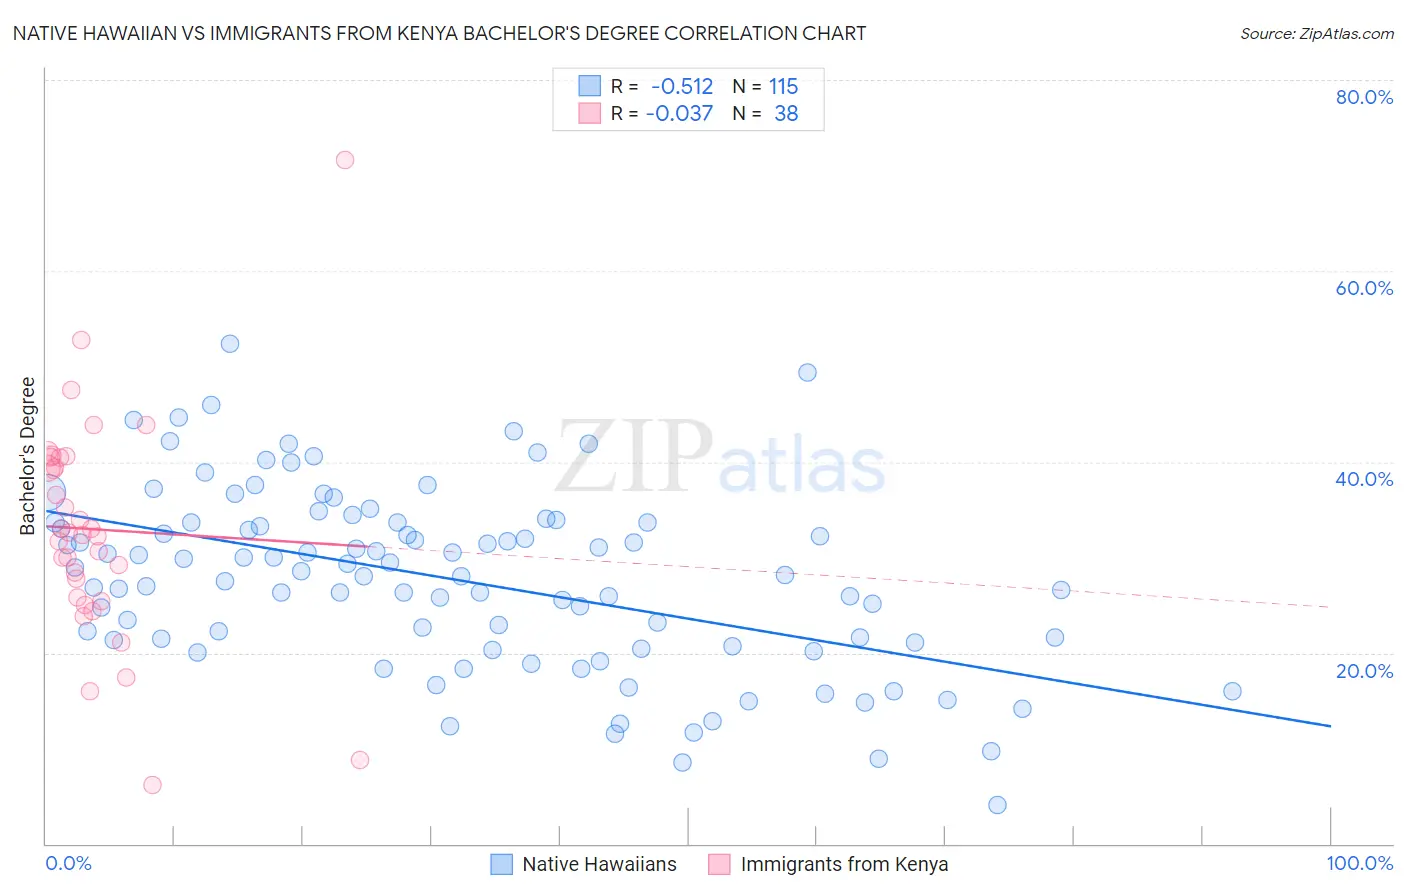
Native Hawaiian vs Immigrants from Kenya Bachelor's Degree Correlation Chart
The statistical analysis conducted on geographies consisting of 332,091,621 people shows a substantial negative correlation between the proportion of Native Hawaiians and percentage of population with at least bachelor's degree education in the United States with a correlation coefficient (R) of -0.512 and weighted average of 33.2%. Similarly, the statistical analysis conducted on geographies consisting of 218,073,270 people shows no correlation between the proportion of Immigrants from Kenya and percentage of population with at least bachelor's degree education in the United States with a correlation coefficient (R) of -0.037 and weighted average of 38.8%, a difference of 16.8%.
Bachelor's Degree Correlation Summary
| Measurement | Native Hawaiian | Immigrants from Kenya |
| Minimum | 4.0% | 6.2% |
| Maximum | 52.3% | 71.6% |
| Range | 48.3% | 65.4% |
| Mean | 27.7% | 32.9% |
| Median | 28.2% | 32.5% |
| Interquartile 25% (IQ1) | 21.1% | 25.8% |
| Interquartile 75% (IQ3) | 33.6% | 40.5% |
| Interquartile Range (IQR) | 12.5% | 14.7% |
| Standard Deviation (Sample) | 9.4% | 11.8% |
| Standard Deviation (Population) | 9.4% | 11.7% |
Similar Demographics by Bachelor's Degree
Demographics Similar to Native Hawaiians by Bachelor's Degree
In terms of bachelor's degree, the demographic groups most similar to Native Hawaiians are Iroquois (33.2%, a difference of 0.020%), U.S. Virgin Islander (33.2%, a difference of 0.060%), Nicaraguan (33.1%, a difference of 0.20%), Immigrants from Bahamas (33.3%, a difference of 0.27%), and Japanese (33.3%, a difference of 0.34%).
| Demographics | Rating | Rank | Bachelor's Degree |
| Immigrants | Congo | 1.0 /100 | #247 | Tragic 33.6% |
| Cree | 1.0 /100 | #248 | Tragic 33.6% |
| Immigrants | Liberia | 0.9 /100 | #249 | Tragic 33.5% |
| Indonesians | 0.9 /100 | #250 | Tragic 33.5% |
| Japanese | 0.7 /100 | #251 | Tragic 33.3% |
| Immigrants | Bahamas | 0.7 /100 | #252 | Tragic 33.3% |
| U.S. Virgin Islanders | 0.7 /100 | #253 | Tragic 33.2% |
| Native Hawaiians | 0.7 /100 | #254 | Tragic 33.2% |
| Iroquois | 0.7 /100 | #255 | Tragic 33.2% |
| Nicaraguans | 0.6 /100 | #256 | Tragic 33.1% |
| Spanish Americans | 0.6 /100 | #257 | Tragic 33.1% |
| French American Indians | 0.6 /100 | #258 | Tragic 33.1% |
| Osage | 0.5 /100 | #259 | Tragic 33.0% |
| Malaysians | 0.5 /100 | #260 | Tragic 32.9% |
| Africans | 0.5 /100 | #261 | Tragic 32.9% |
Demographics Similar to Immigrants from Kenya by Bachelor's Degree
In terms of bachelor's degree, the demographic groups most similar to Immigrants from Kenya are Canadian (38.8%, a difference of 0.15%), Kenyan (38.7%, a difference of 0.15%), Slavic (38.9%, a difference of 0.27%), Sudanese (38.9%, a difference of 0.33%), and Immigrants from Africa (38.9%, a difference of 0.35%).
| Demographics | Rating | Rank | Bachelor's Degree |
| Iraqis | 78.1 /100 | #148 | Good 39.0% |
| Immigrants | Poland | 77.5 /100 | #149 | Good 39.0% |
| South Americans | 77.3 /100 | #150 | Good 38.9% |
| Immigrants | Africa | 76.5 /100 | #151 | Good 38.9% |
| Sudanese | 76.4 /100 | #152 | Good 38.9% |
| Slavs | 75.9 /100 | #153 | Good 38.9% |
| Canadians | 75.0 /100 | #154 | Good 38.8% |
| Immigrants | Kenya | 73.8 /100 | #155 | Good 38.8% |
| Kenyans | 72.5 /100 | #156 | Good 38.7% |
| Immigrants | South America | 70.1 /100 | #157 | Good 38.6% |
| Immigrants | Germany | 69.6 /100 | #158 | Good 38.6% |
| Chinese | 66.6 /100 | #159 | Good 38.5% |
| Vietnamese | 66.6 /100 | #160 | Good 38.5% |
| Uruguayans | 65.8 /100 | #161 | Good 38.4% |
| Colombians | 65.0 /100 | #162 | Good 38.4% |